Best Options Strategies To Trade Market Volatility

Key Takeaways
- Volatility is crucial in options trading, affecting pricing, risk management, market sentiment, and strategy selection.
- High volatility periods offer opportunities with strategies like long straddles and long strangles.
- Low volatility periods are best managed with strategies like iron condors, iron butterflies, covered calls, cash-secured puts, calendar spreads, and diagonal spreads.
Why It Matters
- Understand Volatility: Grasping how volatility impacts options trading helps in making informed decisions.
- Optimize Strategies: Tailor strategies to different volatility environments to maximize profits and manage risks.
- Improve Outcomes: Leveraging tools like the InsiderFinance Options Profit Calculator can provide a competitive edge.
Did you know that traders who effectively leverage volatility in their options strategies can potentially increase their returns by over 50%?
The Importance of Volatility in Options Trading
Volatility, a measure of price variation over time, plays a pivotal role in options trading, influencing everything from pricing to risk management. Understanding and harnessing this dynamic market force can significantly enhance your trading outcomes.
Pricing of Options
Volatility directly influences the premium of an option. High volatility suggests larger potential price swings, leading to higher option premiums. Conversely, low volatility translates to lower premiums, reflecting a stable price expectation.
For instance, during periods of economic uncertainty, such as the financial crisis of 2008, option premiums surged as market volatility spiked. Traders who understood this relationship were able to adjust their strategies and capitalize on the increased premiums.
Risk Management
Grasping volatility is crucial for risk management. High volatility signals the potential for rapid price changes, necessitating robust risk management strategies. For example, during the COVID-19 pandemic in early 2020, market volatility reached unprecedented levels.
Traders who utilized strategies like protective puts or volatility hedges were better able to protect their portfolios from massive losses. Incorporating volatility forecasts, such as those derived from the CBOE Volatility Index (VIX), can help traders prepare for and mitigate potential risks.
Market Sentiment
Volatility is a barometer of market sentiment. High volatility often indicates uncertainty or fear, while low volatility suggests confidence or complacency.
For instance, the VIX, often termed the "fear index," spikes during market turmoil, reflecting heightened investor anxiety. Historical data shows that during the 2016 Brexit referendum, volatility spiked as market participants reacted to the uncertainty of the UK’s future relationship with the EU. By tracking these sentiment indicators, traders can gain insights into the broader market mood and adjust their strategies accordingly.
Options Strategy Selection
Options strategies are tailored to different volatility environments. High volatility strategies, like the long straddle, thrive on significant price movements, whereas low volatility strategies, like the covered call, capitalize on stable markets.
For example, in the tech boom of the late 1990s, traders employing long straddles profited immensely from the dramatic price swings of tech stocks. Conversely, during periods of low volatility, such as the steady growth phase of the mid-2010s, strategies like covered calls and cash-secured puts provided steady income with minimal risk.
Real-World Examples
To illustrate the impact of volatility on options trading, consider the case of Tesla (TSLA) in 2020. As Tesla's stock experienced wild price fluctuations, driven by both market hype and fundamental developments, its implied volatility surged. Traders who purchased straddles or strangles on Tesla options reaped significant rewards as the stock price moved drastically in both directions.
Another example is the use of volatility-based strategies during the 2008 financial crisis. Traders who anticipated the spike in market volatility and employed long put options or volatility ETFs were able to hedge their portfolios effectively against the downturn.
Historical Market Analysis
Historical analysis reveals that periods of high volatility are often followed by substantial price corrections or rallies. According to a study by the National Bureau of Economic Research, markets tend to experience higher returns following periods of elevated volatility. This pattern underscores the importance of understanding and leveraging volatility in options trading.
HIGH POTENTIAL TRADES SENT DIRECTLY TO YOUR INBOX
Add your email to receive our free daily newsletter. No spam, unsubscribe anytime.
Options Strategies for High Volatility Market Conditions
Long Straddle
- Objective: Profit from significant price movements in either direction.
- Structure: A long straddle involves buying a call and a put option at the same strike price and expiration date.
Pros:
- Profits from large price movements, regardless of direction.
- Unlimited profit potential if the underlying asset experiences large price swings.
- Limited risk, which is confined to the premiums paid for the options.
Cons:
- High cost due to purchasing both call and put options.
- Time decay can erode option value if the price remains stagnant, leading to both options expiring worthless.
- Requires substantial movement in the underlying asset to offset the premiums paid.
Market Conditions:
- Earnings Announcements: Ideal for stocks expected to have significant movements around earnings reports.
- Economic Data Releases: Effective during periods of major economic announcements.
- Political Events: Useful when anticipating market reactions to elections, policy changes, or geopolitical tensions.
Tips:
- Monitor implied volatility levels before initiating the strategy; enter when implied volatility is lower to minimize costs.
- Use technical analysis to identify stocks or indices with historical patterns of large price movements.
- Adjust strike prices based on expected price movements and personal risk tolerance.
Google (GOOG) Long Straddle Strategy
To illustrate how a long straddle strategy works in practice, let's consider a trader using this strategy on Google (GOOG).
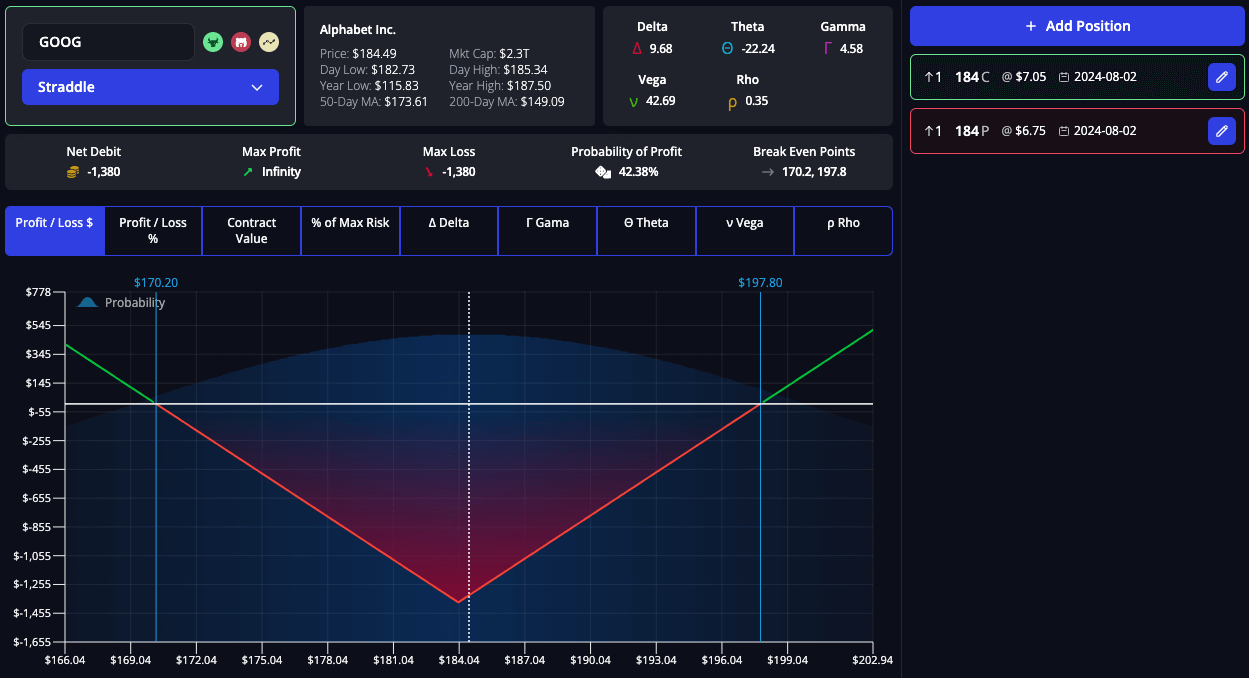
GOOG Strategy Details:
- GOOG Price: $184
- Capital Required: $1,380 (total premiums paid)
Option Legs:
- $184 Long Call with 30-day Expiration
- $184 Long Put with 30-day Expiration
InsiderFinance Options Profit Calculator Analysis:
- Premium Paid: $1,380
- Max Profit: Unlimited
- Max Loss: -$1,380
- Breakeven Prices: $170, $198
- Probability of Profit: 42%
Potential Outcomes:
Profit Scenario:
- If GOOG's price moves significantly in either direction past the breakeven prices of $170 or $198, the trader will profit.
- The trade has a 42% chance of resulting in a profit, according to the Options Profit Calculator analysis.
Loss Scenario:
- If GOOG’s price remains stable, the trader will incur a loss limited to the premiums paid of $1,380.
- The trade has a 58% chance of resulting in a loss, according to the Options Profit Calculator analysis.
Long Strangle
- Objective: Profit from substantial price movements in either direction.
- Structure: A long strangle involves buying a call and a put option with different strike prices but the same expiration date.
Pros:
- Profits from large price movements.
- Lower initial cost compared to a straddle.
- Limited risk, confined to the premiums paid.
Cons:
- Requires even larger price movements to be profitable due to different strike prices.
- Time decay can erode the value if the price remains stagnant.
Market Conditions:
- High Volatility: Optimal during periods of expected high volatility due to upcoming events or market sentiment.
- News Releases: Effective around significant news events impacting a particular stock or sector.
Tips:
- Choose strike prices based on historical volatility and expected price movements.
- Use options with higher delta values to increase the likelihood of profit.
- Monitor market news and sentiment closely to anticipate potential price swings.
Microsoft (MSFT) Long Strangle Strategy
To illustrate how a long strangle strategy works in practice, let's consider a trader using this strategy on Microsoft (MSFT).
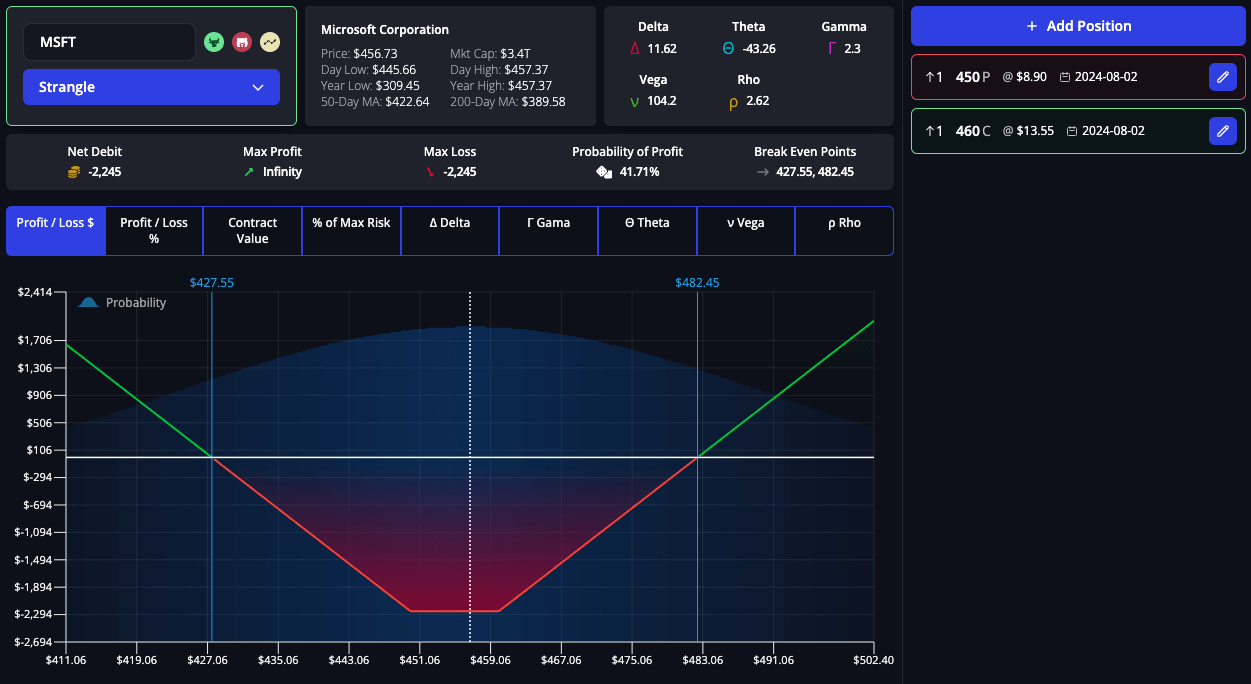
MSFT Strategy Details:
- MSFT Price: $456
- Capital Required: $2,245 (total premium paid for both options).
Option Legs:
- $450 Long Put with 30-day Expiration
- $460 Long Call with 30-day Expiration
InsiderFinance Options Profit Calculator Analysis:
- Premium Paid: $2,245
- Max Profit: Unlimited
- Max Loss: -$2,245
- Breakeven Points: $427, $482
- Probability of Profit: 42%
Potential Outcomes:
Profit Scenario:
- If MSFT moves significantly beyond either breakeven point ($427 or $482), the trader profits from the substantial price movement.
- The trade has a 42% chance of resulting in a profit, according to the Options Profit Calculator analysis.
Loss Scenario:
- If MSFT’s price remains within the strike prices, the loss is limited to the total premium paid of $2,245.
- The trade has a 58% chance of resulting in a loss, according to the Options Profit Calculator analysis.
Options Strategies for Low Volatility Market Conditions
Iron Condor
- Objective: Generate income from stable price movements within a specific range.
- Structure: An iron condor involves selling an out-of-the-money call and put, and buying a further out-of-the-money call and put.
Pros:
- Generates income from net premium received.
- Limited risk due to the purchase of further OTM options.
- Profits from minimal price movement within a defined range.
Cons:
- Limited profit potential.
- Requires precise strike price selection.
- Losses occur if the underlying asset price moves significantly beyond the outer strike prices.
Market Conditions:
- Low Volatility: Suitable during periods of low volatility when the price is expected to remain stable.
- Range-Bound Markets: Effective when the underlying asset is trading within a well-defined range.
Tips:
- Adjust the strike prices based on the expected range of the underlying asset.
- Monitor the position and make adjustments as expiration approaches to maximize profit.
- Use technical indicators to identify strong support and resistance levels.
S&P 500 (SPY) Iron Condor Strategy
To illustrate how an iron condor strategy works in practice, let's consider a trader using this strategy on the S&P 500 (SPY).
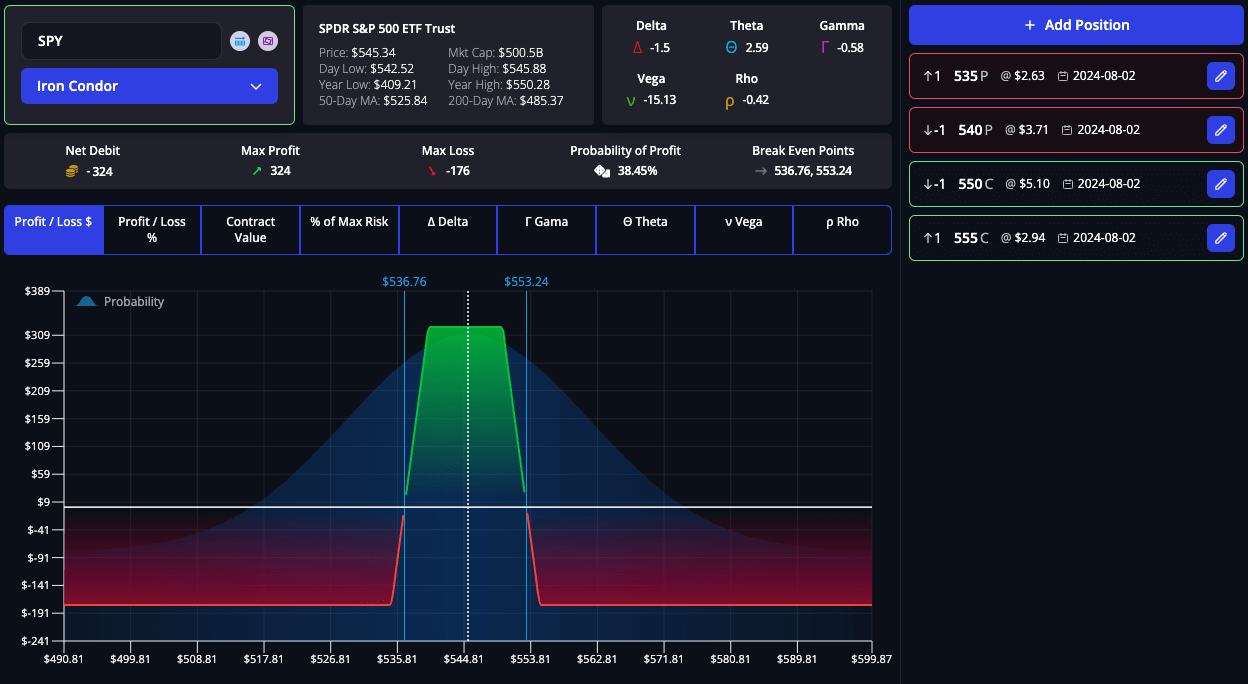
SPY Strategy Details:
- SPY Price: $545
- Capital Required: $324 (difference between the strikes minus the net premium received).
Option Legs:
- $540 Short Put with 30-day Expiration
- $550 Short Call with 30-day Expiration
- $535 Long Put with 30-day Expiration
- $555 Long Call with 30-day Expiration
InsiderFinance Options Profit Calculator Analysis:
- Premium Received: $324
- Max Profit: $324 (net premium received).
- Max Loss: $176 (difference between the strikes minus the net premium received).
- Breakeven Points: $536, $553
- Probability of Profit: 38%
Potential Outcomes:
Profit Scenario:
- If SPY remains within the inner strike prices at expiration, the trader retains the full premium of $324, maximizing profit.
- The trade has a 38% chance of resulting in a profit, according to the Options Profit Calculator analysis.
Loss Scenario:
- If SPY’s price moves beyond the outer strike prices, the loss is capped to $176 due to the protective long put options.
- The trade has a 62% chance of resulting in a loss, according to the Options Profit Calculator analysis.
Iron Butterfly
- Objective: Generate income from minimal price movement around a specific price level.
- Structure: An iron butterfly involves selling a call and a put at the same strike price (at-the-money) and buying an out-of-the-money call and put.
Pros:
- Generates income from net premium received.
- Limited risk due to the purchase of further OTM options.
- Profits from minimal price movement around the strike price.
Cons:
- Limited profit potential.
- Requires precise strike price selection.
- Losses occur if the underlying asset price moves significantly beyond the strike prices.
Market Conditions:
- Low Volatility: Suitable during periods of low volatility when the price is expected to remain stable.
- Consolidation Phases: Effective when the underlying asset is consolidating around a specific price level.
Tips:
- Adjust the strike prices based on the expected price consolidation range.
- Monitor the position and make adjustments as expiration approaches to maximize profit.
- Use historical price data to identify consolidation ranges.
Tesla (TSLA) Iron Butterfly Strategy
To illustrate how an iron butterfly strategy works in practice, let's consider a trader using this strategy on Tesla (TSLA).
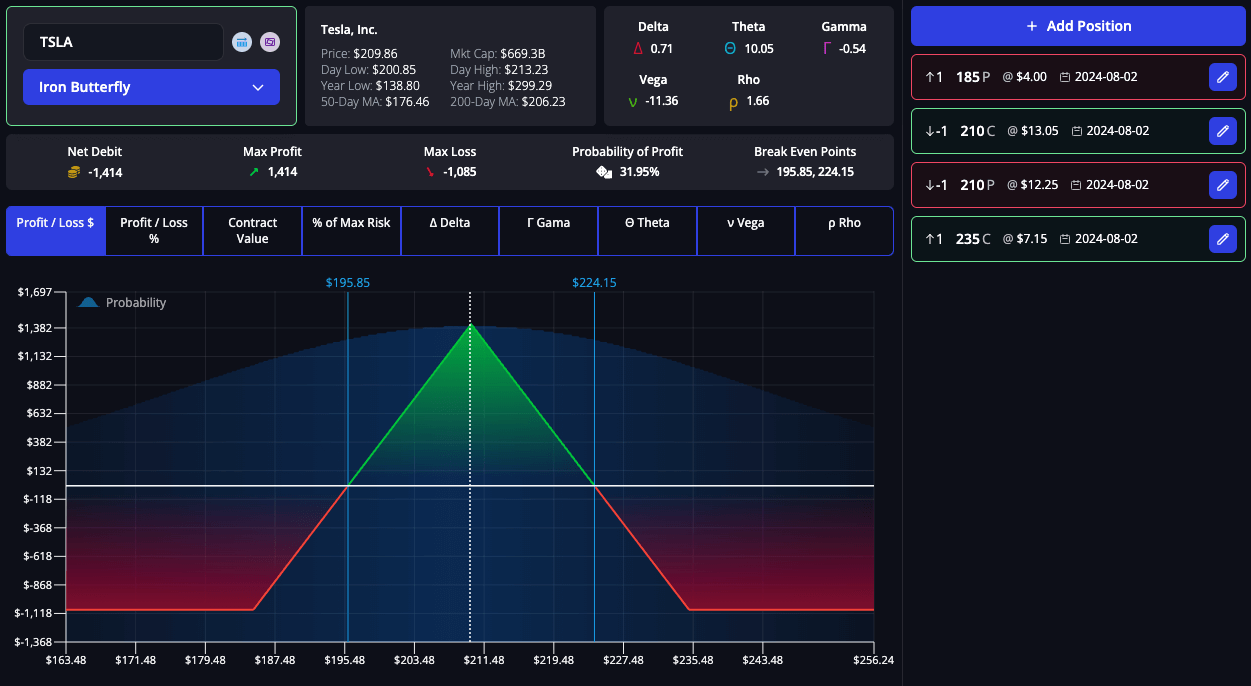
TSLA Strategy Details:
- TSLA Price: $210
- Capital Required: $1,414 (difference between the strikes minus the net premium received)
Option Legs:
- $210 Short Put with 30-day Expiration
- $210 Short Call with 30-day Expiration
- $185 Long Put with 30-day Expiration
- $235 Long Call with 30-day Expiration
InsiderFinance Options Profit Calculator Analysis:
- Premium Received: $1,414
- Max Profit: $1,414 (net premium received).
- Max Loss: -$1,085 (difference between the strikes minus the net premium received)
- Breakeven Points: $196, $224
- Probability of Profit: 32%
Potential Outcomes:
Profit Scenario:
- If TSLA remains around the at-the-money strike price at expiration, the trader retains the full premium ($1,414), maximizing profit.
- The trade has a 32% chance of resulting in a profit, according to the Options Profit Calculator analysis.
Loss Scenario:
- If TSLA’s price moves beyond the outer strike prices, the loss is capped to $1,085 due to the protective long options.
- The trade has a 68% chance of resulting in a loss, according to the Options Profit Calculator analysis.
Covered Call
- Objective: Generate additional income from owning a stock by selling call options.
- Structure: A covered call involves owning the underlying asset and selling a call option on it.
Pros:
- Generates additional income from the premium received.
- Reduces the cost basis of the underlying asset.
- Provides a partial hedge against a decline in the stock price.
Cons:
- Limited profit potential if the underlying asset price rises significantly.
- Requires ownership of the underlying asset, tying up capital.
- The call option limits the upside potential of the underlying asset.
Market Conditions:
- Stable Markets: Ideal during periods of low volatility when the stock price is expected to remain stable.
- Mildly Bullish Trends: Effective when expecting a moderate rise in the stock price.
Tips:
- Select call options with strike prices slightly above the current stock price to maximize premium income while allowing for some upside potential.
- Use technical analysis to identify resistance levels where the stock price might stall.
- Regularly review and adjust positions based on changes in market conditions and the underlying asset's price movement.
Amazon (AMZN) Covered Call Strategy
To illustrate how a covered call strategy works in practice, let's consider a trader using this strategy on Amazon (AMZN).
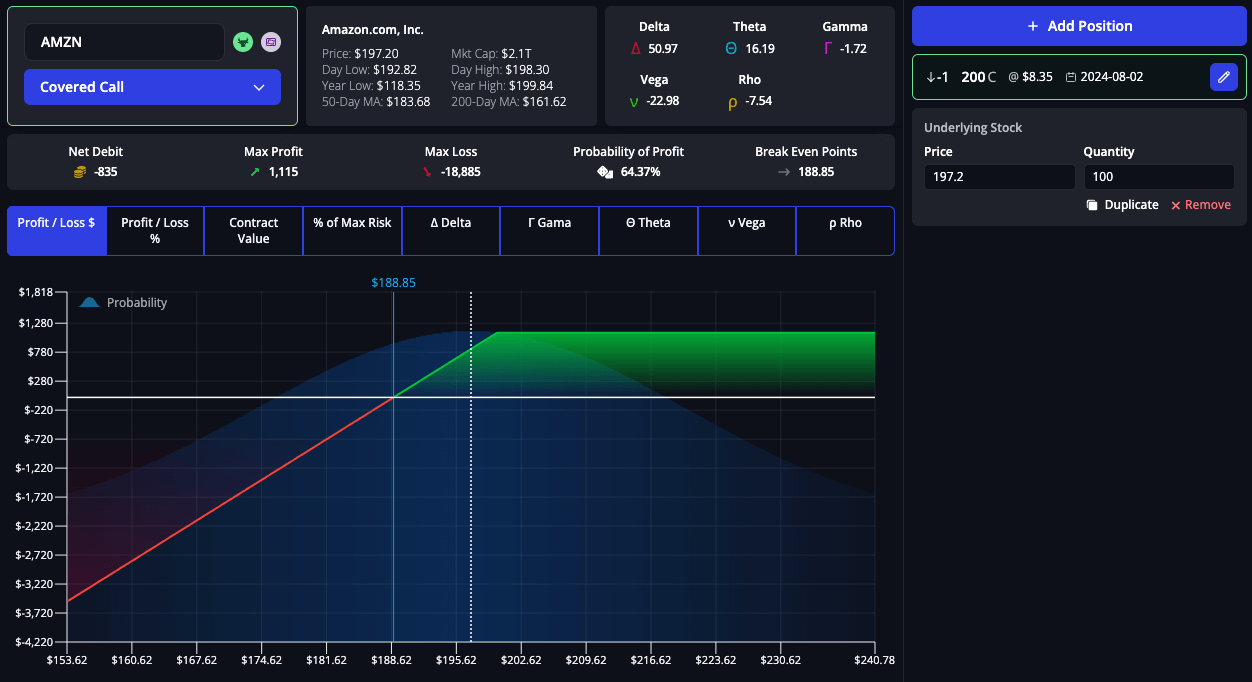
AMZN Strategy Details:
- AMZN Price: $197
- AMZN Shares Owned: 100
- Cash Held: $0
- Capital Required: Cost of 100 shares
Option Legs:
- $200 Short Call with 30-day Expiration
InsiderFinance Options Profit Calculator Analysis:
- Premium Received: $835
- Max Profit: $1,115 (premium + stock appreciation up to the strike price)
- Max Loss: Unlimited (downside risk of owning the stock, offset by the premium received)
- Breakeven Price: $189
- Probability of Profit: 64%
Potential Outcomes:
Profit Scenario:
- If AMZN's price stays below the strike price ($200), the trader retains the premium of $835 and continues to hold the stock.
- The trade has a 64% chance of resulting in a profit, according to the Options Profit Calculator analysis.
Loss Scenario:
- If AMZN's price rises above the strike price ($200), the stock will be called away, limiting profit to the strike price plus the premium received.
- The trade has a 36% chance of resulting in a loss, according to the Options Profit Calculator analysis.
Cash-Secured Put
- Objective: Generate income with the intention to purchase the underlying asset at a lower price.
- Structure: A cash-secured put involves selling a put option while holding enough cash to buy the underlying asset if exercised.
Pros:
- Earns premium income while waiting to buy the underlying asset at a lower price.
- Limited risk, as the trader is prepared to buy the asset at the strike price.
- Reduces the cost basis of the underlying asset if assigned.
Cons:
- Potentially missing out on upside if the underlying asset rises significantly.
- Requires sufficient cash to secure the purchase of the underlying asset.
- The put option limits downside protection if the asset's price falls below the strike price.
Market Conditions:
- Stable to Mildly Bearish Markets: Ideal during periods of low volatility when the stock price is expected to remain stable or decline slightly.
- Moderate Declines: Effective when willing to buy the stock at a lower price.
Tips:
- Choose strike prices slightly below the current stock price to increase the likelihood of assignment while maximizing premium income.
- Use fundamental analysis to identify stocks with strong long-term potential.
- Monitor market conditions and adjust strike prices based on changes in volatility and stock price movement.
NASDAQ 100 (QQQ) Cash-Secured Put Strategy
To illustrate how a cash-secured put strategy works in practice, let's consider a trader using this strategy on the NASDAQ 100.
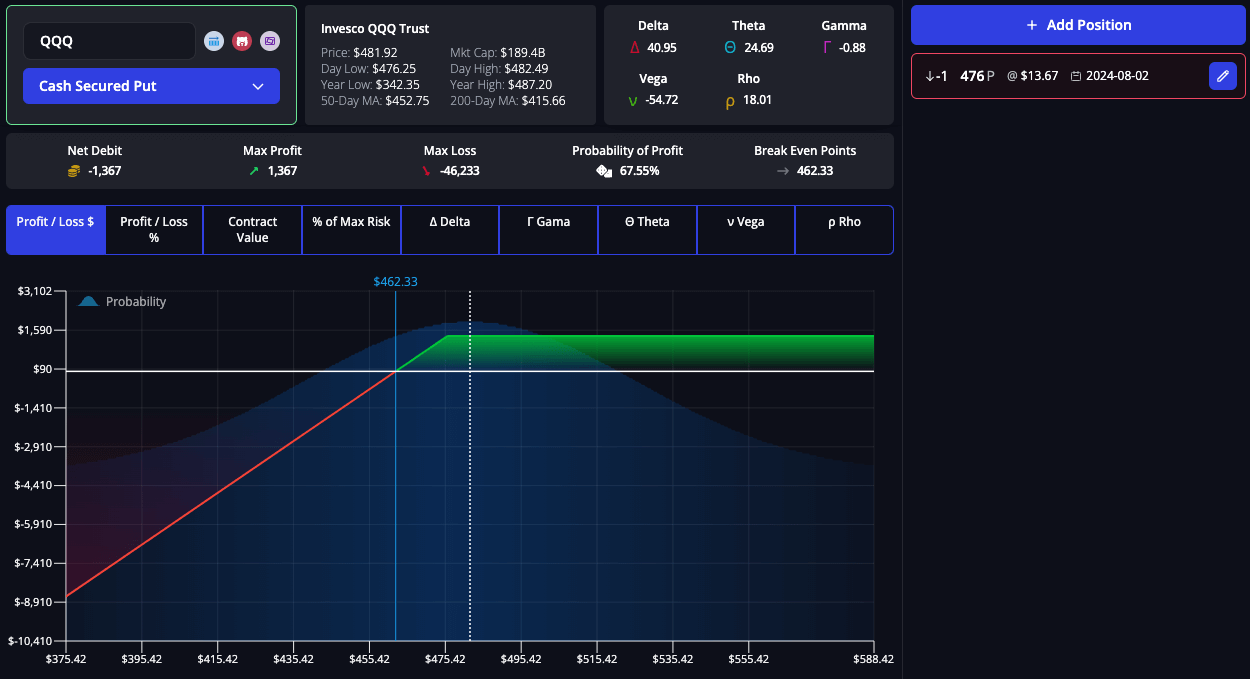
QQQ Strategy Details:
- QQQ Price: $482
- QQQ Shares Owned: 0
- Capital Required: $48,200 (to buy 100 shares if assigned)
Option Legs:
- $476 Short Put with 30-day Expiration
InsiderFinance Options Profit Calculator Analysis:
- Premium Received: $1,367
- Max Profit: $1,367 (premium received)
- Max Loss: -$46,233 (strike price - premium received)
- Breakeven Price: $462
- Probability of Profit: 68%
Potential Outcomes:
Profit Scenario:
- If QQQ’s price stays above the strike price ($476), the trader retains the premium of $1,367 and does not buy the stock.
- The trade has a 68% chance of resulting in a profit, according to the Options Profit Calculator analysis.
Loss Scenario:
- If MSFT price falls below the strike price ($476), the trader buys the stock at the strike price, with the premium received offsetting the cost.
- The trade has a 32% chance of resulting in a loss, according to the Options Profit Calculator analysis.
Calendar Spread
- Objective: Profit from time decay and minimal price movement in the underlying asset.
- Structure: A calendar spread involves buying a longer-term option and selling a shorter-term option with the same strike price.
Pros:
- Benefits from time decay on the short-term option.
- Lower cost compared to buying a single long-term option.
- Can be adjusted or rolled as the short-term option approaches expiration.
Cons:
- Requires stable or predictable price movement.
- Limited profit potential.
- Risk of loss if the underlying asset moves significantly in either direction.
Market Conditions:
- Stable Markets: Ideal during periods of low volatility when the price is expected to remain stable.
- Predictable Price Movements: Effective when expecting minimal price changes in the underlying asset.
Tips:
- Choose strike prices near the current stock price to maximize time decay.
- Monitor the position and roll the short-term option as expiration approaches to extend the trade.
- Use historical data to select assets with low volatility and predictable price patterns.
Apple (AAPL) Calendar Spread Strategy
To illustrate how a calendar spread strategy works in practice, let's consider a trader using this strategy on Apple (AAPL).
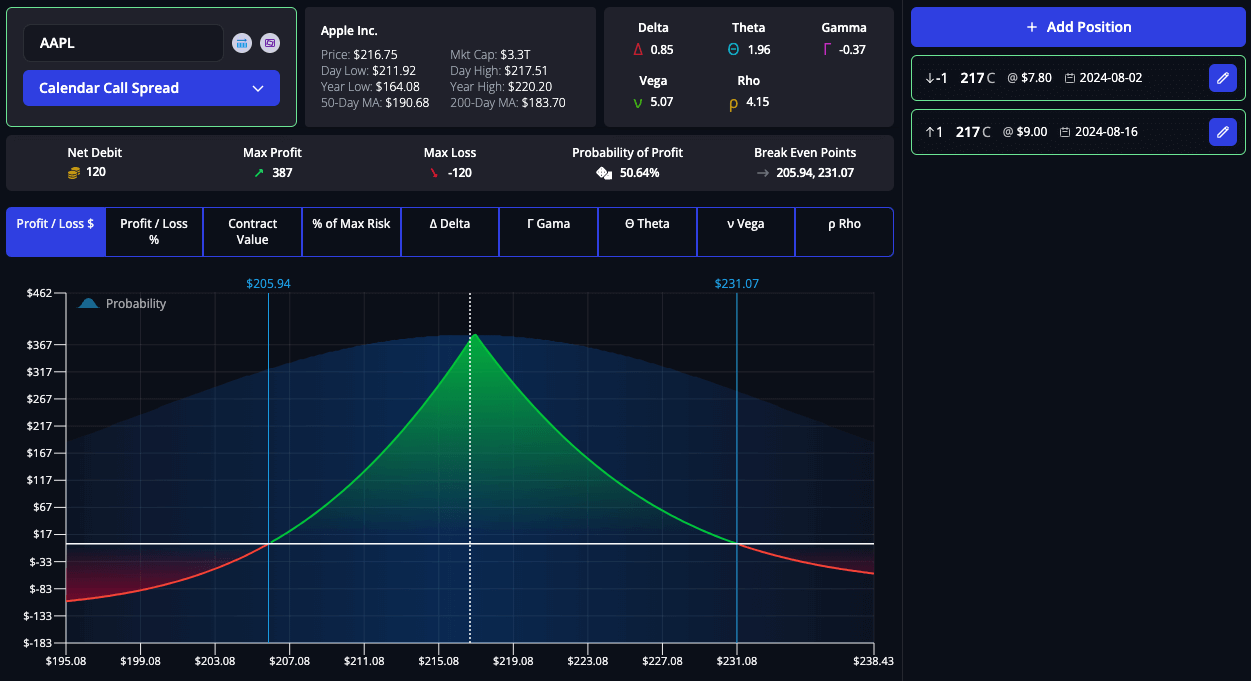
AAPL Strategy Details:
- AAPL Price: $217
- Capital Required: Net premium paid
Option Legs:
- $217 Long Call with 60-day Expiration
- $217 Short Call with 30-day Expiration
InsiderFinance Options Profit Calculator Analysis:
- Premium Paid: $120
- Max Profit: $387 (if the stock price remains near the strike price)
- Max Loss: -$120 (net premium paid)
- Breakeven Price: $206, $231 (could change with adjustments and rolls)
- Probability of Profit: 51%
Potential Outcomes:
Profit Scenario:
- If AAPL’s price stays near the strike price, the trader profits from the time decay of the short-term option.
- The trade has a 51% chance of resulting in a profit, according to the Options Profit Calculator analysis.
Loss Scenario:
- If AAPL’s price moves significantly, the trader may incur a loss limited to the net premium paid.
- The trade has a 49% chance of resulting in a loss, according to the Options Profit Calculator analysis.
Diagonal Spread
- Objective: Profit from both time decay and gradual price movement in the desired direction.
- Structure: A diagonal spread involves buying a longer-term option and selling a shorter-term option with a different strike price.
Pros:
- Benefits from time decay on the short-term option.
- Allows for gradual price movement in the underlying asset.
- Can be adjusted or rolled as the short-term option approaches expiration.
Cons:
- Requires precise selection of strike prices and expiration dates.
- Limited profit potential compared to other strategies.
- Risk of loss if the underlying asset moves significantly in the opposite direction.
Market Conditions:
- Stable to Mildly Trending Markets: Ideal during periods of low volatility with a slight directional bias.
- Gradual Price Movements: Effective when expecting slow and steady price changes.
Tips:
- Choose strike prices and expiration dates based on expected price movements and time decay.
- Monitor the position and roll the short-term option as expiration approaches to extend the trade.
- Use technical analysis to identify trends and price targets.
NVIDIA (NVDA) Diagonal Spread Strategy
To illustrate how a diagonal spread strategy works in practice, let's consider a trader using this strategy on NVIDIA (NVDA).
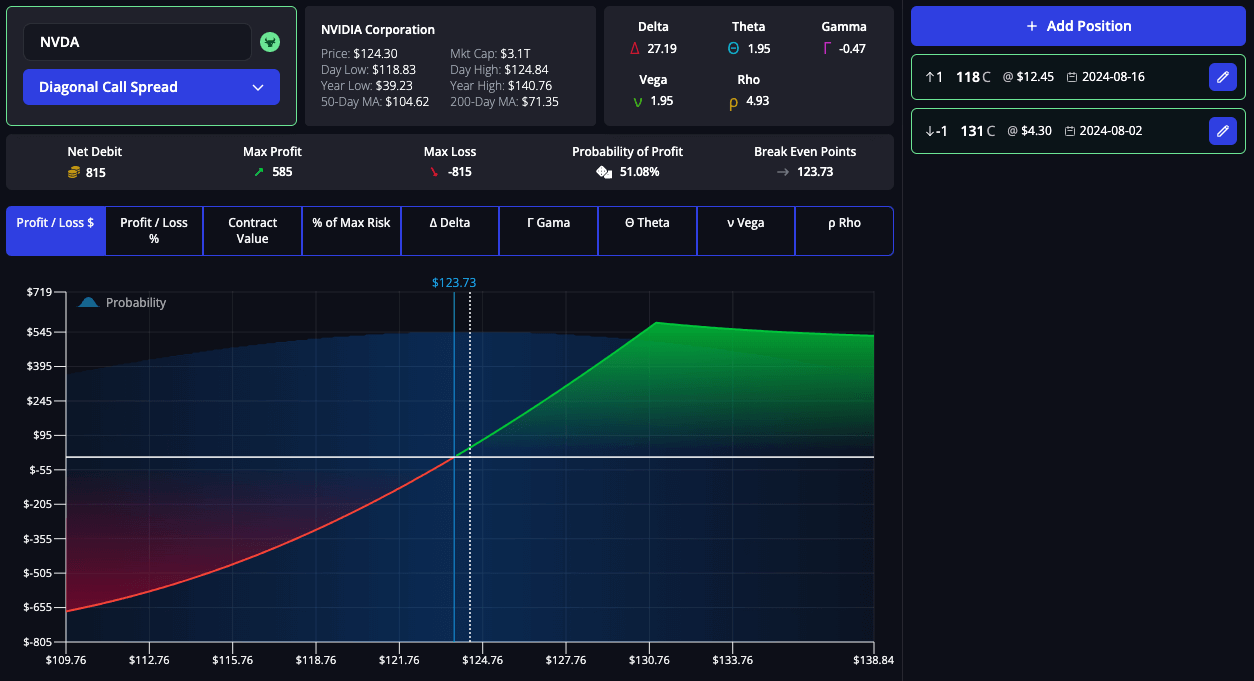
NVDA Strategy Details:
- NVDA Price: $124
- Capital Required: $815 (net premium paid)
Option Legs:
- $118 Long Call with 60-day Expiration
- $131 Short Call with 30-day Expiration
InsiderFinance Options Profit Calculator Analysis:
- Premium Paid: $815
- Max Profit: $585 (if the stock price moves gradually towards the short strike price)
- Max Loss: -$815 (net premium paid)
- Breakeven Price: 124 (could change with adjustments and rolls)
- Probability of Profit: 51%
Potential Outcomes:
Profit Scenario:
- If NVDA’s price moves gradually towards the short strike price ($131), the trader profits from both time decay and price movement.
- The trade has a 51% chance of resulting in a profit, according to the Options Profit Calculator analysis.
Loss Scenario:
- If NVDA’s price moves significantly in the opposite direction, the trader may incur a loss limited to the net premium paid of $815.
- The trade has a 49% chance of resulting in a loss, according to the Options Profit Calculator analysis.
Comparing the Best Options Strategies for Volatility
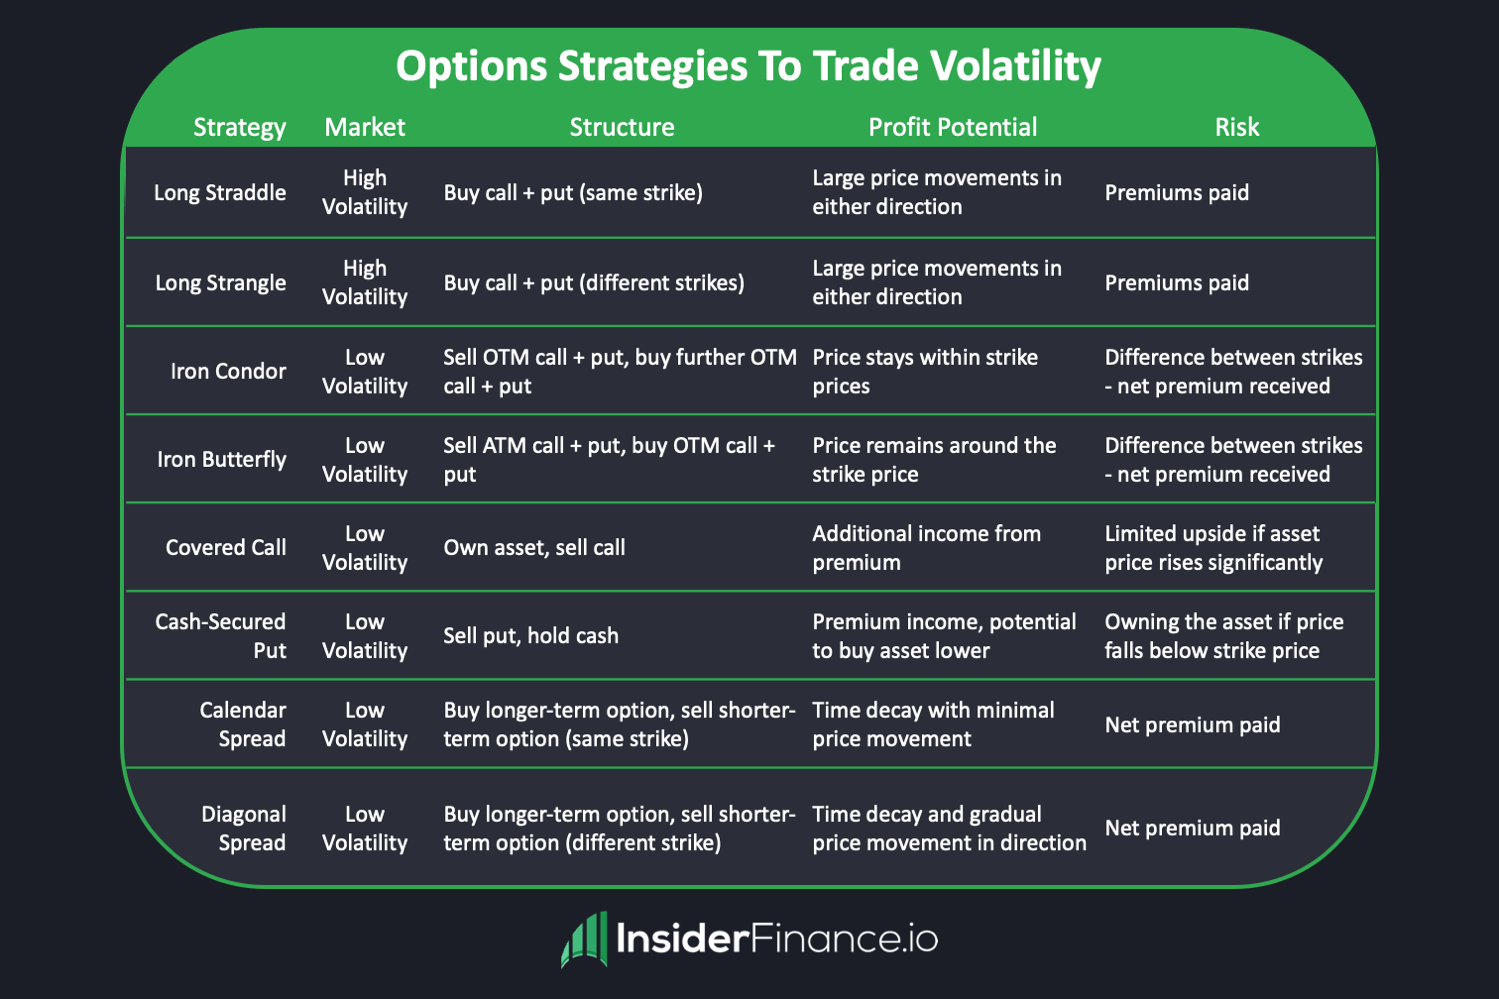
Long Straddle
- Market Sensitivity: Ideal during earnings reports, regulatory announcements, or any event that could trigger significant price movements. Always monitor implied volatility to ensure entry at a lower cost.
- Execution: Purchase a call and put option at the same strike price and expiration. This ensures profit potential in either direction.
Long Strangle
- Flexibility: Suitable for high volatility but offers a cheaper alternative to straddles. Use when there’s a strong expectation of movement but less certainty about direction.
- Execution: Buy a call and put option with different strike prices. This requires a more significant price movement to be profitable but reduces initial costs.
Iron Condor
- Range Trading: Profits from stability within a specific price range. Ideal when the market shows strong support and resistance levels.
- Execution: Sell an out-of-the-money call and put, and buy further out-of-the-money call and put options. This caps both potential profit and loss.
Iron Butterfly
- Precision Required: Best used when expecting minimal price movement around a central strike price. Often used during periods of anticipated low volatility.
- Execution: Sell at-the-money call and put options, and buy out-of-the-money call and put options. This strategy is highly dependent on the accuracy of the strike price selection.
Covered Call
- Income Generation: Perfect for stable or mildly bullish markets. Provides a way to earn additional income from existing stock holdings.
- Execution: Sell call options on stocks you already own. This strategy reduces downside risk slightly but limits upside potential.
Cash-Secured Put
- Strategic Entry: A conservative strategy for entering a stock position at a lower price while earning premium income. Ideal for stocks you want to own.
- Execution: Sell put options while holding enough cash to cover the purchase of the stock if the option is exercised. This ensures you are prepared to buy the stock if its price falls.
Calendar Spread
- Time Decay Advantage: Profits from the differential time decay of options. Best used when expecting minimal price changes.
- Execution: Buy a longer-term option and sell a shorter-term option at the same strike price. Regular adjustments can extend the trade and capture continued time decay.
Diagonal Spread
- Directional Bias: Combines benefits of time decay and price movement. Useful in slowly trending markets.
- Execution: Buy a longer-term option and sell a shorter-term option at a different strike price. Adjustments can be made to capture gradual price trends while benefiting from time decay.
Tips for Trading Volatility
- Volatility Assessment: Always evaluate current and historical volatility before choosing a strategy. Utilize tools like the InsiderFinance Options Profit Calculator to accurately project outcomes.
- Risk Management: Diversify strategies to manage risk effectively. Combining high and low volatility strategies can provide balance and reduce potential losses.
- Regular Monitoring: Constantly monitor your positions and adjust as necessary. Volatility can change rapidly, impacting the effectiveness of your chosen strategy.
- Educational Resources: Continuously educate yourself on market conditions and strategy adjustments. Keeping up-to-date with financial news and market trends can provide the edge needed for successful trading.
Benefits of Using the InsiderFinance Options Profit Calculator
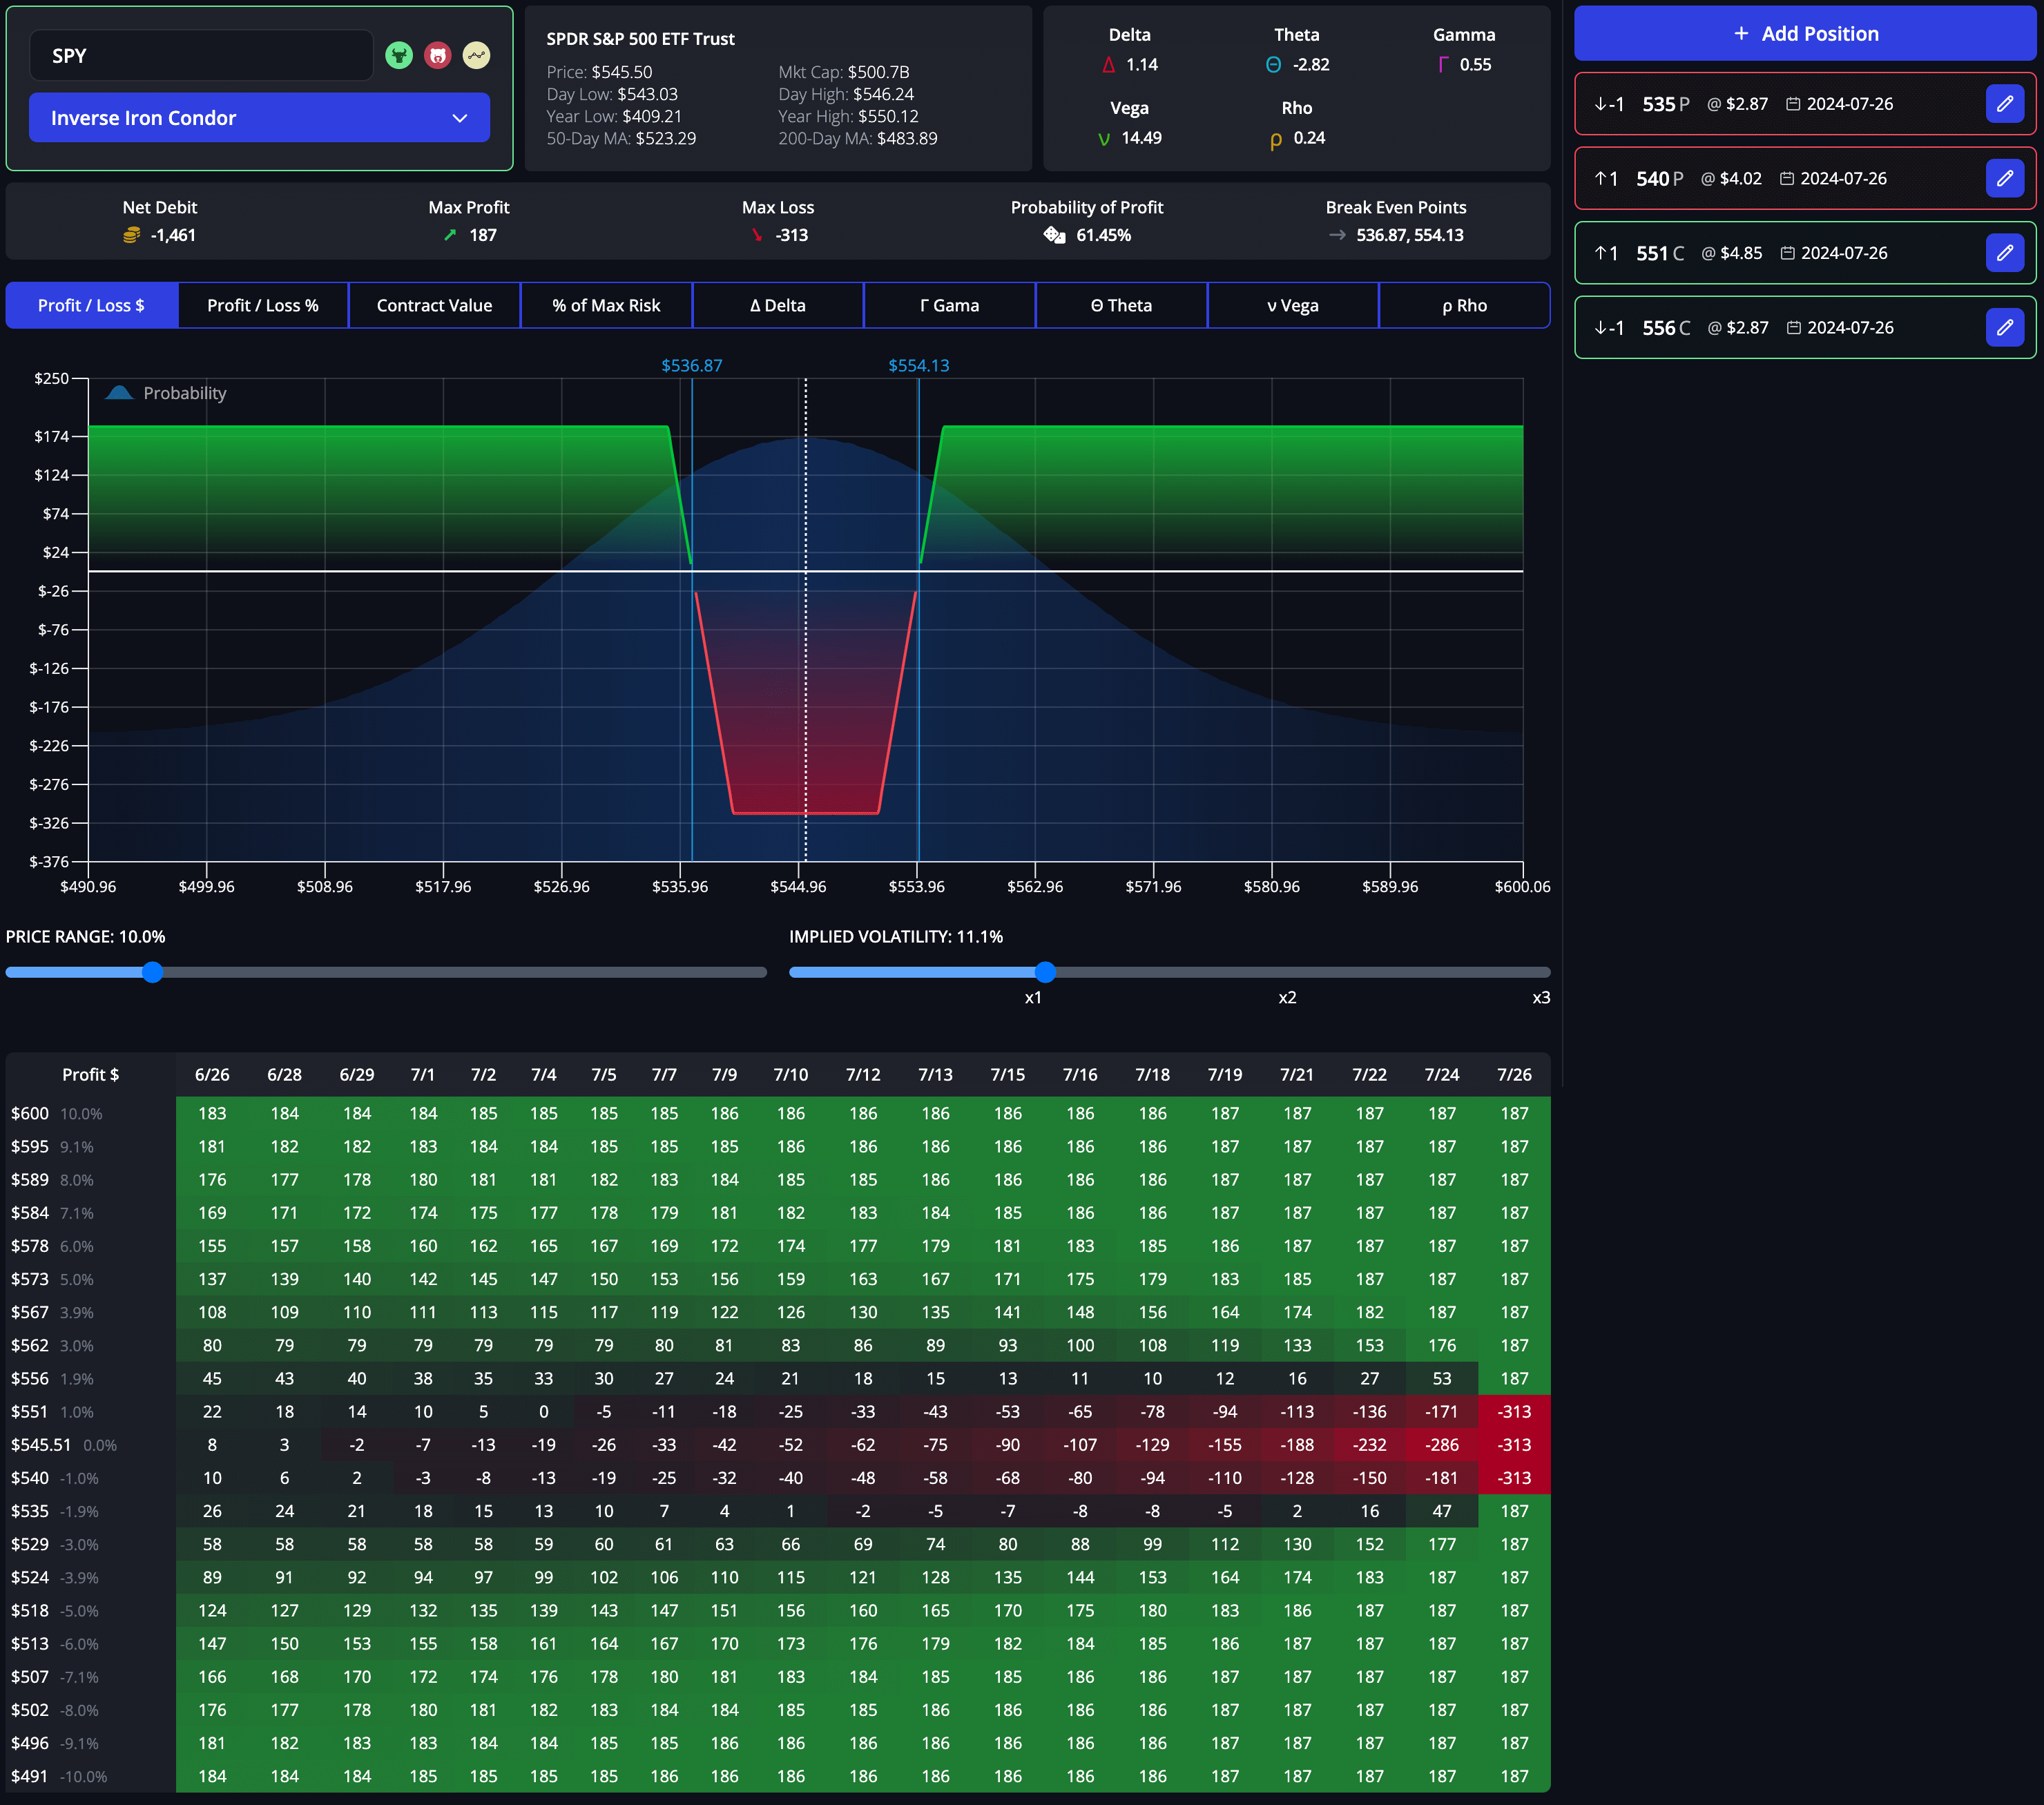
The InsiderFinance Options Profit Calculator is an indispensable tool for options traders, offering a seamless user experience and unparalleled accuracy. Here’s why you should integrate it into your trading strategy:
- Accurate Profit and Loss Projections: Provides precise calculations of potential profits and losses, helping you make informed decisions.
- Detailed Breakeven Analysis: Offers clear breakeven points for each strategy, ensuring you understand the price movements required for profitability.
- Probability of Profit Estimates: Calculates the likelihood of your trade being profitable, giving you a statistical edge.
- Comprehensive Scenario Analysis: Allows you to simulate different market scenarios, helping you prepare for various outcomes.
- User-Friendly Interface: Designed for ease of use, ensuring that even beginners can navigate and utilize the tool effectively.
- Real-Time Data Integration: Incorporates the latest market data, ensuring that your calculations are based on current information.
By leveraging the InsiderFinance Options Profit Calculator, you can enhance your trading strategies, optimize risk management, and increase your chances of success in the options market.
Ready to take your options trading to the next level? Try the InsiderFinance Options Profit Calculator for free today and experience the difference it can make in your trading outcomes.
HIGH POTENTIAL TRADES SENT DIRECTLY TO YOUR INBOX
Add your email to receive our free daily newsletter. No spam, unsubscribe anytime.
FAQs
What is the role of volatility in options trading?
Volatility measures the price fluctuations of a financial instrument over time. In options trading, it influences option pricing, risk management, market sentiment, and strategy selection, making it crucial for traders to understand and leverage.
How does high volatility affect options pricing?
High volatility increases the potential for significant price movements, leading to higher option premiums. This is because the likelihood of the option ending in-the-money increases, raising the cost of the option.
What are the best options strategies for high volatility periods?
For high volatility periods, the best options strategies include long straddles, long strangles, iron condors, and iron butterflies. These strategies profit from large price movements or stability within a specific price range.
How can I profit from low volatility in options trading?
In low volatility periods, strategies like covered calls, cash-secured puts, calendar spreads, and diagonal spreads are effective. These strategies capitalize on minimal price movements and time decay.
What is a long straddle strategy?
A long straddle involves buying a call and a put option at the same strike price and expiration date. It profits from significant price movements in either direction and is ideal for high volatility periods.
How does an iron condor strategy work?
An iron condor involves selling an out-of-the-money call and put, and buying further out-of-the-money call and put options. This strategy profits from stability within a specific price range, making it suitable for high volatility periods.
What is the difference between a long strangle and a long straddle?
Both strategies profit from large price movements, but a long strangle involves buying a call and a put option with different strike prices, whereas a long straddle uses the same strike price for both options. Long strangles are generally cheaper but require more significant price movements to be profitable.
Why should I use the InsiderFinance Options Profit Calculator?
The InsiderFinance Options Profit Calculator provides accurate profit and loss projections, detailed breakeven analysis, probability of profit estimates, comprehensive scenario analysis, a user-friendly interface, and real-time data integration, enhancing your trading strategies and decision-making.
How do covered calls generate income?
Covered calls involve owning the underlying asset and selling a call option on it. This strategy generates additional income from the premium received while providing a partial hedge against a decline in the stock price.
What is a cash-secured put strategy?
A cash-secured put involves selling a put option while holding enough cash to buy the underlying asset if exercised. This strategy generates premium income and allows you to purchase the asset at a lower price if its price falls below the strike price.

