How to Trade in Confluence with Technical Analysis (And Increase Your Win Rate)
Why Most Traders Lose Money
It’s a well-known fact that only roughly 90% of retail traders lose money. That’s most retail traders. So, how do you become successful? The answer has changed over time.
Historically, the successful 10% had the best access to information. Financial data and complex analysis were only available to institutions and professional traders not long ago. Access to market-moving data and powerful tools was closely guarded and difficult to obtain.
As a result, institutional traders had a massive information advantage over retail traders for many years. So, it’s not surprising that retail traders typically lose money when making decisions with far less information.
Luckily, this dynamic has changed in recent years. The modern retail trader has access to endless amounts of information, but accessing this information is no longer the challenge.
The problem now is that traders are drowning in a sea of information and need to analyze and interpret complex data almost instantly to make better trading decisions in less time. Speed and accuracy matter now more than ever.
How to Trade Successfully Using Confluence
Today, the successful 10% use institutional-grade tools to generate trade ideas and validate their trade decisions using a concept called confluence. Confluence combines multiple data points, indicators, strategies, or analyses into a single, comprehensive strategy.
In a trading strategy using confluence, every trade decision is supported by several indicators and analyses, all in agreement, to increase the chances of success within the current market context.
The foundation of a confluence trading strategy is typically overlaying multiple technical indicators onto the same chart and comparing multiple time frames.
Why? High-potential trade ideas have a much higher chance of success when supported by robust technical analysis.
Challenges Using Technical Analysis
The sea of information now available to retail traders includes an endless list of technical analysis indicators. As a result, many traders struggle to understand which technical indicators to use and how to interpret them.
Looking at the same chart patterns and dated technical analysis techniques everyone uses doesn’t work anymore because markets evolve to eliminate obvious imbalances or trading edges. So, more and more technical indicators have been developed to find a new edge no one else has yet discovered.
This constant development resulted in new, highly sophisticated technical indicators designed to use confluence to find the next trading edge.
However, because sophisticated technical indicators are complex to understand and challenging to implement, traders need fast and accurate technical analysis software to instantly identify optimal entries/exits and trade confidently.
Automated Technical Analysis
The InsiderFinance Automated Technical Analysis System accurately predicts when to buy and sell stocks, options, crypto, forex, and futures - without the complex and sometimes confusing analysis.
Gone are the hours spent staring at endless indicators overlapping each other on charts to the point where it’s impossible to interpret them all.
Instead, our easy-to-use, comprehensive system eliminates the guesswork of reading charts, allowing traders to make decisions faster and more accurately.
The proprietary system adjusts itself for any symbol in any asset class with impressive precision to detect optimal entries and exits. It also has dual oscillators to drastically reduce false signals.
The tool also includes an automated risk management system with take-profit and stop-loss levels adjustable for risk tolerance, along with caution candles/dots, all designed to work together to time exits perfectly.
HIGH POTENTIAL TRADES SENT DIRECTLY TO YOUR INBOX
Add your email to receive our free daily newsletter. No spam, unsubscribe anytime.
How to Trade in Confluence with Technical Analysis
The foundation of our technical analysis system is a combination of proprietary and well-known indicators from multiple sources, which allows us to identify trends with unmatched accuracy.
Traders only receive a buy/sell signal when our high-performing indicators are in confluence.
In the context of technical analysis, confluence is simply combining more than one indicator, pattern, or analysis to increase your odds of winning when trading.
Traders gain an edge when multiple technical indicators using different price concepts from various non-correlated techniques show the same trend.
Historically, trades made when technical indicators are in confluence have a higher potential of working out successfully.
Finding confluence can also eliminate noise when it comes to a validating signal.
Our proprietary system is designed so traders can enter every trade with confidence, knowing strong technical indicators in confluence are backing every position.
Automated Tools to Trade in Confluence
Our charting tools simplify technical analysis, resulting in highly successful trades for any asset class and satisfied traders of any skill level.
Our automated technical analysis system comes with everything needed to trade faster and more confidently:
- Trend Consensus
- Risk Management
- Dual Oscillators
- Multiple Trend Confirmations
- Swing Signals
- Caution Candles and Dots
- Support and Resistance
Trend Consensus
The first tool automates trend consensus and combines over 15 technical indicators in confluence into one simple Algo buy/sell signal.

Each green (buy) or red (sell) signal is backed by an elaborate series of proven indicators that all work together to give you the most accurate predictions based on market trends from multiple sources.
Algo buy/sell signals next to trend reversal diamonds or confirmation triangles indicate potential swings, as shown in the case studies below.
Risk Management
A well-defined risk management strategy can make all the difference in whether traders are profitable.
Traders can significantly increase profits using a data-driven framework to decide when to trim positions while winners run and when to cut losses early.
The automated risk management function does that automatically so traders can stop guessing when to take profits or where to set stop losses.
Three take profit levels and a stop loss level are automatically generated for each buy/sell signal. The stop loss level is adjustable for risk tolerance.

In the example above, the Algo generated a short signal with a stop loss at $453.54 and three take profit levels at $438.07, $432.98, and $426.19.
Using these levels, traders can cut losses early at the stop loss level or take profits along the way to de-risk the trade while keeping a position to capture further gains.
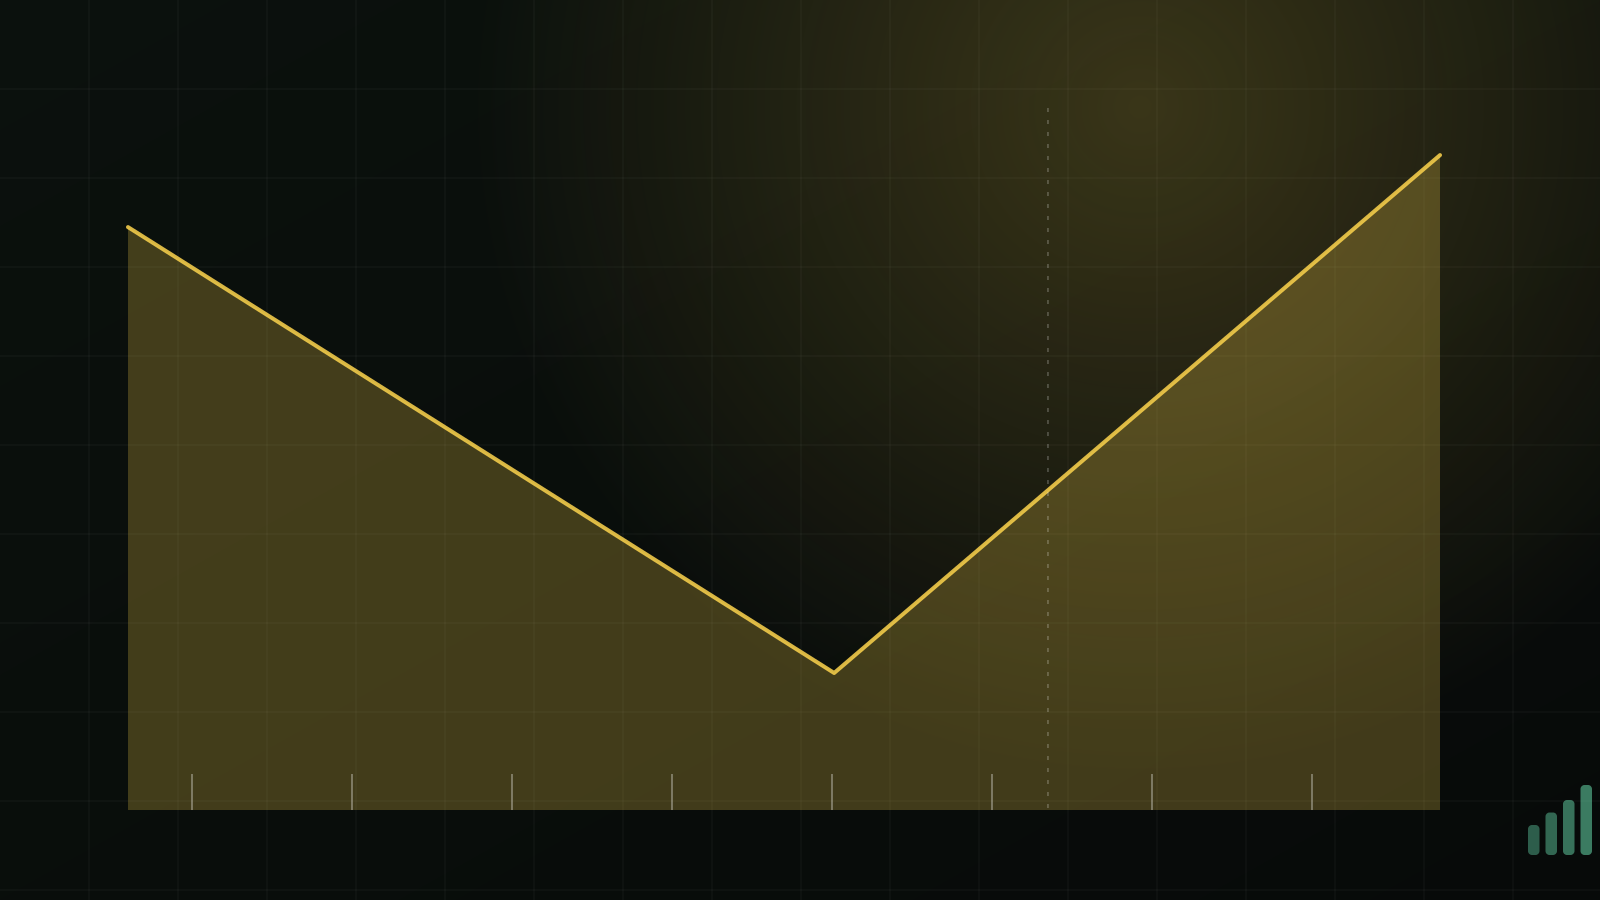
Dual Oscillators
Our Momentum and Squeeze oscillators confirm entry and exit signals and drastically reduce false signals.

Our proprietary Squeeze indicator confirms bull trends and bear trends.
An upward green bar indicates an accelerating bull trend, and an upward red bar indicates a slowing bull trend.
A downward red bar indicates an accelerating bear trend, and a downward green bar indicates a slowing bear trend.
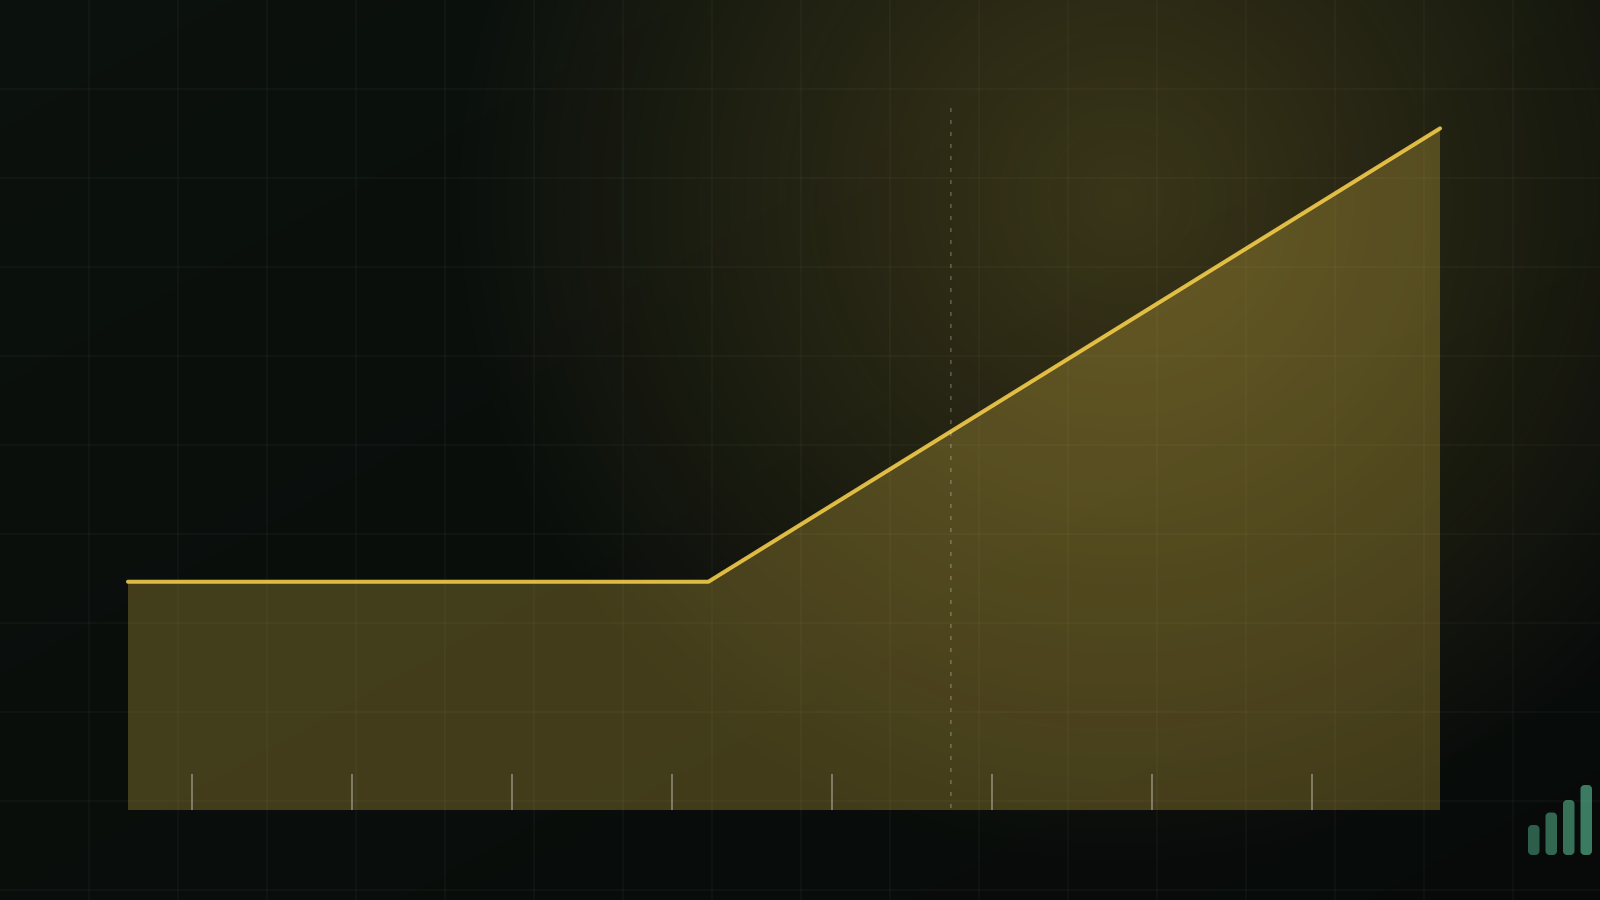
Our proprietary Momentum indicator confirms bull swings and bear swings.
A green ribbon floating upward indicates a bull swing, and a red ribbon floating downward indicates a bear swing.
Both oscillators have green (buy) or red (sell) dots to quickly identify strong buy or sell signals.
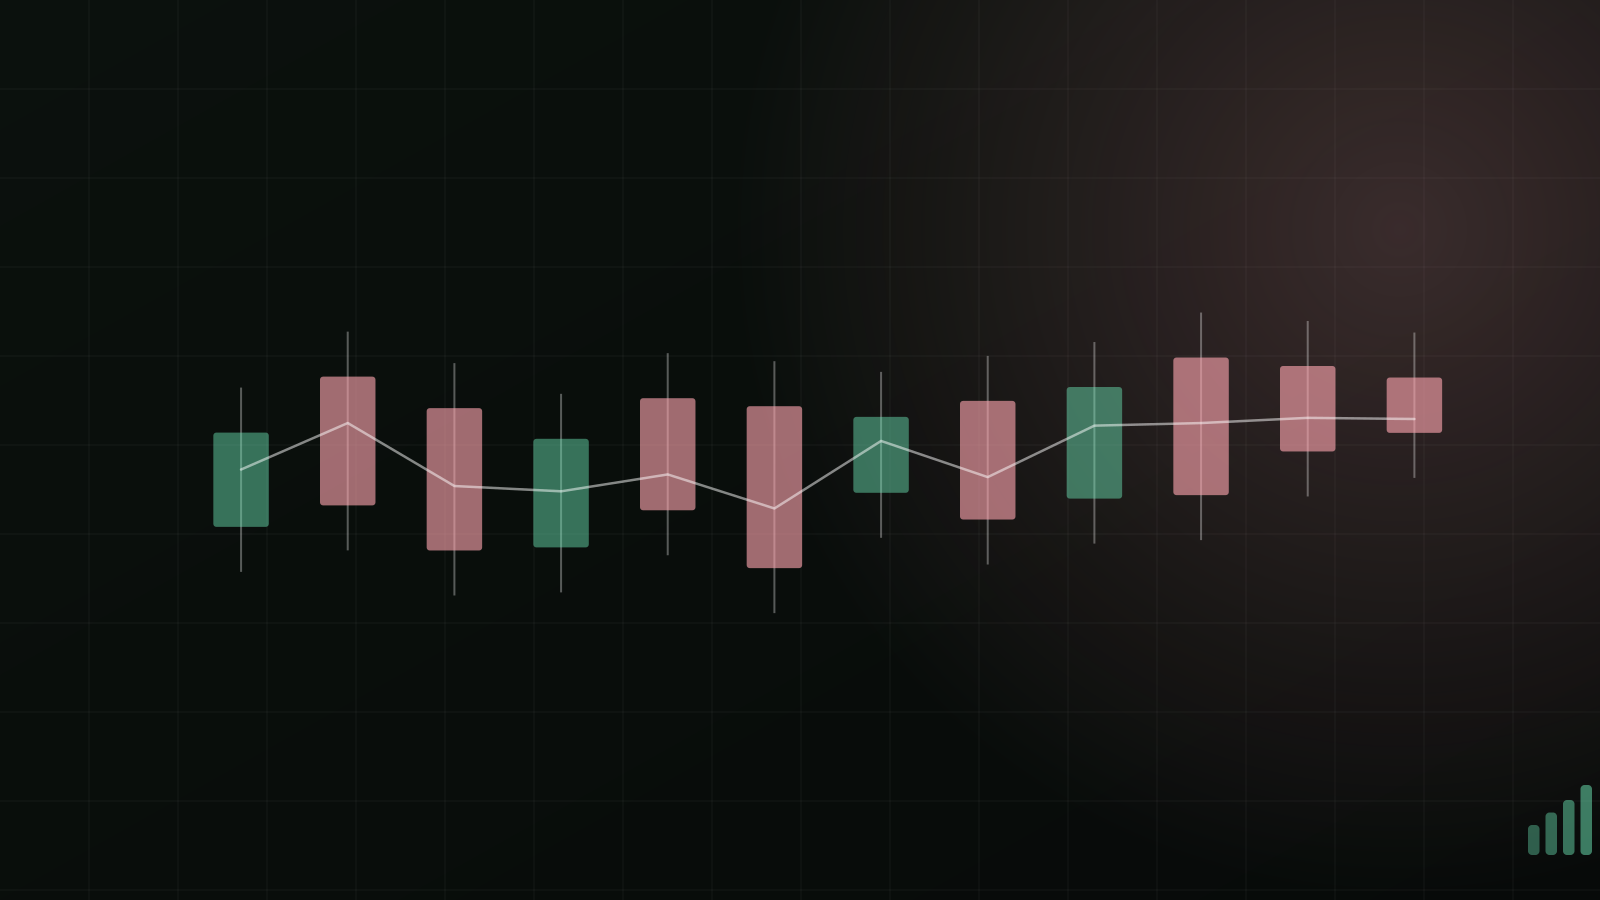
Trend Confirmation Line
Trend confirmation lines confirm bull trends or bear trends and are used together with Algo buy/sell signals to eliminate “false” signals.

The solid Trend Line confirms buy/sell signals; the dotted line is the long-term moving average.
Let's look at the above chart to show how the solid Trend Line can be used with the Algo buy/sell signals.
At the first Algo sell signal, the Trend Line is still strong and green, indicating a bull trend, and the Algo switches back to Buy shortly after. This is an example of a temporary or false signal.
However, the Trend Line switches to red at the second Algo sell signal, indicating a bear trend, and the second Algo sell signal holds. This is an example of the Trend Line confirming the Algo sell signal.
By looking at the Trend Line in conjunction with the Algo buy/sell signals, traders can better identify "false" or "temporary" signals.
Trend Triangles
Trend Triangles confirm buy signals or sell signals as part of our 4-Point Confirmation System.

Traders can combine the trend triangles, and Algo buy/sell signals for added confidence in the trend direction.
The more indicators showing the same trend, the better chance the trend prediction will hold. That’s confluence!
Swing Diamonds
Swing Diamonds, which include bull swing diamonds and bear swing diamonds, identify potential trend reversals and are also part of our 4-Point Confirmation System.

Swing Diamonds can be used to confirm entry signals or as a take-profit signal.
Traders can also create swing alerts for any ticker in any asset class and time frame.
Swing signals are shown visually on the chart as Swing Diamonds. The script generates three alerts:
Long
- Buy signal backed up bull swing diamond. This combination means that 90% of our indicators show a bull signal.
Short
- Sell signal backed up bear swing diamond. This combination means that 90% of our indicators show a bear signal.
Trend Change
- Algo switches from Buy to Sell or Sell to Buy without 90% consensus.
Traders can set up alerts for any tickers they're watching or have positions in and monitor for potential entries/exits or trend changes.
For example, if a trader enters TSLA after receiving a Long alert and then sees a Trend Change alert or Short alert, that could potentially indicate a need to take profits or exit the position altogether.
Caution Candles and Dots
Caution Candles enable traders to spot trend slowdowns with yellow caution bars effortlessly.

Caution Dots warn traders if a trend is touching a support/resistance level. Red caution dots signal a potential resistance level, and green caution dots signal a potential support level.
Caution Candles and Caution Dots visually notify traders that a trend may be weakening or close to changing.
Support and Resistance Levels
Bollinger Bands and Moving Average Lines help traders easily find support and resistance levels.

4-Point Confirmation System for Trade Entry
Generally, the more data points supporting a trade decision, the higher the probability of success. Again, that’s confluence!
That’s why we designed our 4-point confirmation system to improve the chance of success on every trade. It’s the ultimate indication of confluence.

1. Buy/Sell Signal
- Buy/Sell Signals are part of the INSIDERFINACE ALGO and are shown on the chart as a green B (buy) or red S (sell) label.
- This is the first and most crucial confirmation signal because many technical indicators in confluence are used to determine each signal.
2. Swing Diamond/Trend Triangles
- Swing Diamonds and Trend Triangles are part of the INSIDERFINACE ALGO and are shown on the chart as a green (bullish) or red (bearish) diamond/triangle.
- Seeing a Swing Diamond or Trend Triangle below a Buy/Sell signal (as in the example above) confirms the Buy/Sell signal.
- This is the second confirmation signal before entering a trade.
3. Momentum Signal
- Momentum signals are part of the INSIDERFINACE MOMENTUM indicator. They are shown on the chart as a green (bullish) or red (bearish) ball, indicating the beginning of a potential bull (green) or bear (red) breakout swing.
- This is the third confirmation signal before entering a trade.
4. Squeeze Signal
- Squeeze signals are part of the INSIDERFINACE SQUEEZE indicator. They are shown on the chart as a green (bullish) or red (bearish) ball above or below the histogram bars, indicating the beginning of a potential bull (green) or bear (red) trend.
- This is the fourth confirmation signal before entering a trade.
The image above shows all four bull confirmations present before entering the trade. At the high point of the chart, three of the four bear confirmations are present before the big bear move down.
The 4-Point Confirmation System gives traders the highest likelihood of success by combining multiple indicators into a single strategy (i.e. trading in confluence).
Even though the 4-Point Confirmation System stacks the odds for success in the trader’s favor, traders should still consider placing a stop loss as market conditions can impact even the most promising trades.
Multiple Time Frames
The indicators are optimized for shorter time frames, making them more "sensitive" for detecting trends faster.
The calculations are the same regardless of which chart time frame is used, and we recommend looking at multiple time frames to add another level of confluence.
The "higher" the time frame, the longer "term" the trend.
- 1-Hour: Short Term
- 4-Hour: Long Term
- Daily: Macro Trend
Macro Trend Time Frame
We think of the daily chart as the macro "established" trend.
Traders have the best chance of success when trading in the same direction as the daily chart (i.e. taking a long position when the daily chart is bullish).
However, for day traders planning a very quick in and out, the 4-hour likely serves as that.
Short-Term Trend Time Frame
The short-term trend (i.e., 1-hour chart) indicates the direction the ticker is likely headed for the day (or at least a portion of it).
However, if the short-term trend is showing a different direction than the daily chart (i.e., the “macro” trend), the overall trend may still be intact if the same trend is on multiple higher-time frame charts.
For example, let’s say the 1-hour chart is bullish, and the daily chart is bearish. Typically, we don’t want to trade against the macro trend, so we should check other time frames before trading.
Long-Term Trend Time Frame
Looking at the time frames between 1-hour and daily, we see that both the 2-hour and 4-hour charts are bullish. Because multiple time frames below daily are all bullish, we can still consider entering this trade as long as we don’t plan to hold for more than a few days.
Typically, we like to take some profits early (at the first take-profit level shown in the Algo), so we have less capital at risk and mostly play with "house money."
Now that we have de-risked the position, we can watch the higher time frame charts to see when the trend changes to exit the remainder of our position.
Luckily, we don’t have to stare at monitors all day to accomplish this. We can simply create swing alerts for our positions on a few higher time frames and exit when we receive an alert that the trend has changed.
Signs to Exit
The technical analysis system comes with everything traders need to time the perfect exit:
Take Profit & Stop Loss Levels
- Three take profit levels and a stop loss level are automatically generated for each buy/sell signal.
- If the price goes below the stop loss level or above any of the take profit levels, that’s typically the time to consider taking profits or cutting losses.
Caution Candles and Dots
- Yellow candles and caution dots indicate the current trend is slowing down or changing.
- If the chart shows multiple yellow candles or caution dots, that’s typically a good time to consider taking profits or cutting losses.
Trend Changes
- Signs of an opposite trend or a change in trend direction are worth evaluating.
- For example, consider taking profits or exiting a long position when the chart shows sell signals, bear caution dots, or bear trend reversal diamonds.
- Consider taking profits or exiting a short position when the chart shows buy signals, bull caution dots, or bull trend reversal diamonds.
The above signals help traders determine the best time to take profits or exit a position. Traders can also create swing alerts to be notified of any change in trend, which would be a good time to take profit or exit altogether.
Most importantly, remember to stick to the trade plan and keep emotion out of the process. Cut losses or take profits early and let winners run.
Confluence Case Studies
Let’s combine these concepts by looking at a few charts with multiple indicators in agreement to see the power of confluence in action.
Remember: entries are strongest when also supported by signals from dual oscillators (not shown here but confirmed before entering).
MT

Above is the 2-hour chart for MT on October 7. The chart had an Algo buy signal, Trend Triangle, and Swing Diamond all aligned.
The strongest buy/sell signals are ones where the Algo buy/sell signal and Swing Diamond are on the same bar or 1 bar apart (that's when almost all of our indicators agree on the trend).
LVS

Above is the 1-hour chart for LVS on October 8. This chart has an Algo buy signal and Swing Diamond.
Traders should consider taking profits when the price reaches a take profit level or the trend changes (i.e. a sell signal in a bull trend).
ATER

Above is the 1-hour chart for ATER on September 7, which has an Algo buy signal and Swing Diamond very close together.
Most case studies are on 1-2 hour charts, but traders can use the technical analysis system for much shorter or longer time frames.
The same principles apply regardless of the chart time frame.
Start Trading in Confluence
After these case studies, you’re ready to start trading in confluence (and winning on more trades)!
Remember to set stop losses and start with small amounts/paper trading, especially if these concepts are new to you. They’re powerful concepts, but always protect your capital as you’re learning something new.
HIGH POTENTIAL TRADES SENT DIRECTLY TO YOUR INBOX
Add your email to receive our free daily newsletter. No spam, unsubscribe anytime.