How to Trade Unusual Options Activity Using InsiderFinance

What is Unusual Options Activity?
Put simply, Unusual Options Activity (UOA) represents anomalies in the Options Order Flow (i.e. the 6M+ options contracts traded on a daily basis).
Millions of options contracts are traded daily, but most aren’t very interesting.
However, in those millions of trades, there are always a few “unusual” options trades that don’t seem to make sense under normal circumstances.
We call these anomalies Unusual Options Activity, and oftentimes, this unusual activity serves as a leading indicator ahead of a large movement in the underlying stock.
What kind of anomalies are considered Unusual Options Activity?
There’s no single definition for Unusual Options Activity, but below are a few key characteristics that have proven to be indicative of large upcoming movements:
Single options contract with large volume compared to the average contract size
- In other words, a large concentration in a single contract
Large spike in options volume compared to the daily average
- Up to 5-10 times more than the daily average
Short expiration time frame
- This implies an expectation of a quick movement happening before the expiration date
Far out of the money
- The strike is very far from the spot rate, implying an expectation of a large movement
Large increase in open interest
- This indicates a new or “fresh” position
Why Trade Unusual Options Activity?
So why do we care about these unusual options trades?
The answer is simple: these trades give us high-potential trade ideas if identified correctly.
The main drivers of why we typically see unusual options activity are what makes Unusual Options Activity such a powerful leading indicator of upcoming market movements.
Primary Drivers of Unusual Options Activity
- A highly leveraged bet on insider information smart money used its unfair advantage to receive legally
- A highly leveraged bet or hedge before known catalyst events
- A highly leveraged bet or hedge before unexpected catalyst events
- A hedge on equity positions
Examples of known catalyst events
- Earnings reports
- Dividend announcements
- Product launches
Examples of unexpected catalyst events
- Influential analysts upgrade or downgrade the stock
- Black swan event
- A new short seller report released
- An activist investor taking a new position in a company
- Unexpected CEO announcement
Let’s start with why we may see Unusual Options Activity as a hedge on an equity position.
Unusual Options Activity as a Hedge
An institution may have a large equity position (long or short) in an individual ticker.
Instead of selling that equity position with possible tax implications, they use options as hedges to limit their exposure to short-term volatility.
In this scenario, institutions trade bearish options if they have a long position in the underlying equity or bullish options if they have a short position in the underlying equity.
The same logic applies to hedges against known or unexpected catalysts.
An institution may choose to use an option to hedge against the short-term volatility that will likely follow the catalyst event if it maintains the same long-term sentiment and doesn’t want to sell to avoid short-term volatility.
While it’s certainly possible that institutions are hedging short positions with bullish options trades, it’s much more common to see bearish options trades used as hedges against the downside.
Typically, institutional investors trade bullish options on individual tickers to build positions.
They also trade bearish options on ETF tickers like SPY as hedges to limit their exposure to an overall market downturn.
That’s why we recommend trading bullish Unusual Options Activity on individual tickers (not ETFs) - to greatly eliminate the possibility that the trade was executed as a hedge.
More commonly, bullish unusual options activity typically originates from “smart money” making huge leveraged bets on short-term market direction, either before a catalyst event or from inside sources.
Trade Alongside Smart Money
Smart Money is the group of key players that control the market, accounting for over 70% of total trade volume.
They’re the hedge funds, proprietary trading firms, institutional banks, and billionaires that set the tone for the rest of the market.
This group of Wall Street insiders uses their considerable resources to legally identify market-moving information before the rest of us, giving them a significant information advantage over the average investor (you and me).
Because their information advantage makes it much harder for them to lose, they can confidently take large positions in highly leveraged options trades and multiply their profits.
This is where having the right tools can make all the difference.
Identifying these large positions made with high conviction gives investors like you and me the same advantage as smart money without spending millions on the same massive resources.
That’s where InsiderFinance comes in.
We figured out how to expose the high-probability Unusual Options Activity that smart money is confidently trading to multiply their profits so you can trade alongside smart money into the hottest unusual options trades on Wall Street.
HIGH POTENTIAL TRADES SENT DIRECTLY TO YOUR INBOX
Add your email to receive our free daily newsletter. No spam, unsubscribe anytime.
How to Identify Unusual Options Activity
So, how can you find these high-potential anomalies in the options order flow?
It all starts with the data.
Because there is no single definition for Unusual Options Activity, it’s not straightforward (unless you’re using a cutting-edge order flow platform like InsiderFinance).
Most platforms that claim to show Unusual Options Activity all source their data from the same data source with mixed results.
A rare few like InsiderFinance have a proprietary method of identifying unusual activity with a track record of strong results.
Underpinning the InsiderFinance platform is a proprietary algorithm that intelligently processes and filters the options flow and dark pool prints to increase your probability of success.
Unlike other options flow tools that use the same cookie-cutter data source and basic filtering, InsiderFinance starts with the raw feed (i.e., 6M+ options contracts traded daily) and uses proprietary processing and filtering, developed by a trained Wall Street quant, to only show you unusual options activity that has the potential to be market-moving.
Our advanced algorithm does all the heavy lifting behind the scenes to identify high-probability Unusual Options Activity, and our dashboard brings the highest-potential trades front and center!
Top Tickers
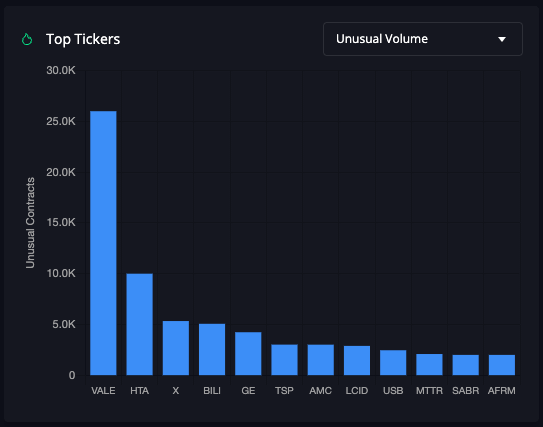
InsiderFinance has multiple categories of unusual options activity Top Tickers on both the Flow Dashboard and the dedicated Top Tickers Page.
Flow Dashboard
- Unusual Out of the Money (OTM)
- Unusual Volume
- Unusual Premium
Top Tickers Page
- Unusual Out of the Money (OTM)
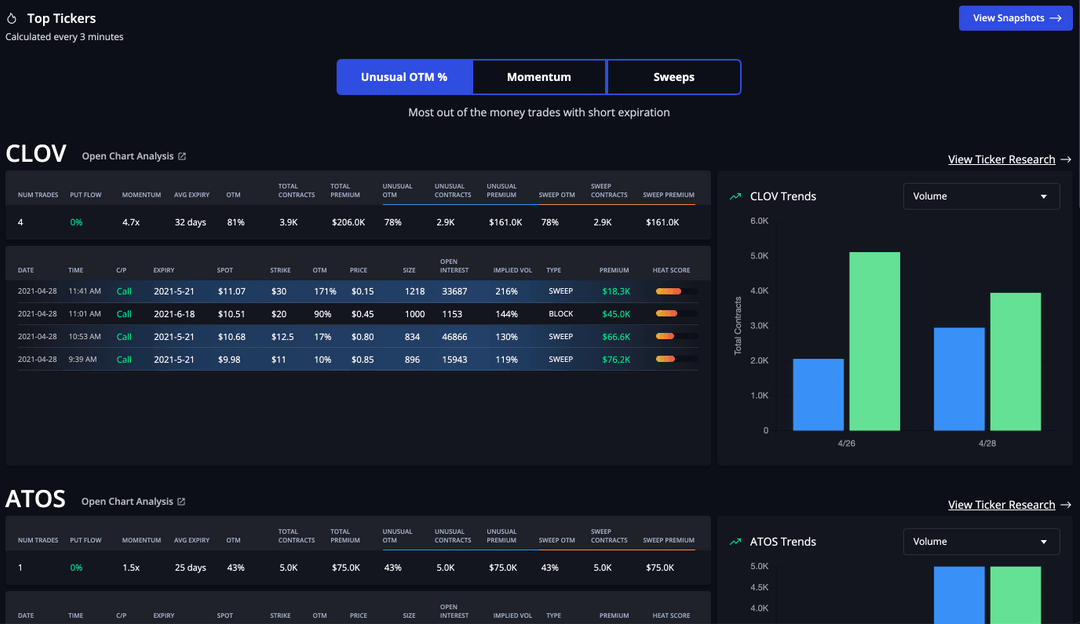
The Top Tickers page features tickers that are different from those on the Flow Dashboard.
The main difference is that any ticker on the Top Tickers page has a high OTM% and strong “agreement” on the trade direction.
These signal categories fit different trading styles and different trade performances.
In our experience, Unusual trades tend to move the “slowest” (1-3 days to play out), which gives you more time to find an optimal entry.
Many members have had success adding their favorite top tickers to the watchlist and waiting to enter the trade when they show strong technical indicators.
We recommend using the technical analysis tools included with your subscription.
You can even set custom alerts for any ticker on any time frame!
Actionable Preset
Choose the Unusual Actionable Preset to filter the entire dashboard for Unusual Options Activity with one click—no more digging through distracting order flow!

Smart Market Insight by Ticker
Institutional-grade order flow context, aggregated by ticker, helps you see the big picture and quickly find high-potential tickers with Unusual Options Activity.

Sort by any column to bring the tickers that fit your trade style front and center, or use the Command Center to tailor the filters even further.
To see tickers with high conviction, we recommend filtering by Ticker Flow to see stocks with close to 100% bullish or bearish flows.
Tickers with close to 100% bullish or bearish flows mean smart money agrees on whether they think the price will go up or down.
Real-Time Options Flow
Using the Unusual Actionable Preset or filtering for Unusual in the Command Center filters the real-time order flow for Unusual Options Activity.
A powerful approach is sorting by Heat Score to bring high-potential trades front and center.
This can be a great way to discover trade ideas.
For example, the top three trades with a high Heat Score in the table below are on the ticker RLX.

How to Trade Unusual Options Activity
Our 3 Steps to Trade article captures our typical routine to spot good candidates for any trading style.
Generally, the more data points supporting a trade idea, the higher the probability of success.
For Unusual Options Activity, we like bullish trades on individual tickers with the most support behind them:
Repeated calls and close to 0% put flow
- Close to 0% put flow means that Wall Street is in agreement that the price will rise
Recent dark pool activity
- Green highlights or gold boxes are ideal
Strong technicals
- 4-point confirmation on the 1-hour chart and ideally also the 4-hour chart
Positive news sentiment
- Mostly positive sentiment and no major red flags in recent headlines
Bullish sector activity
- Bullish sector sentiment helps you avoid trading “against the current”
High Heat Scores
- Trades were made with high conviction
Find Unusual Options Activity Trade Ideas Using Top Tickers
One of our favorite strategies for trading Unusual Options Activity is picking them straight from the Top Tickers page, which displays algorithmically curated trade ideas in real-time. It’s that easy!
That doesn’t mean you can trade blindly, though.
Many members have had success adding their favorite top tickers to the watchlist and waiting to enter the trade when they show strong technical indicators.
We recommend using the technical analysis tools included with your subscription.
You can even set custom alerts for any ticker on any time frame.
We recommend the 1-hour and 4-hour charts for Unusual Options Activity.
Here’s an example of our process. First, we find PROG on the Top Tickers page.
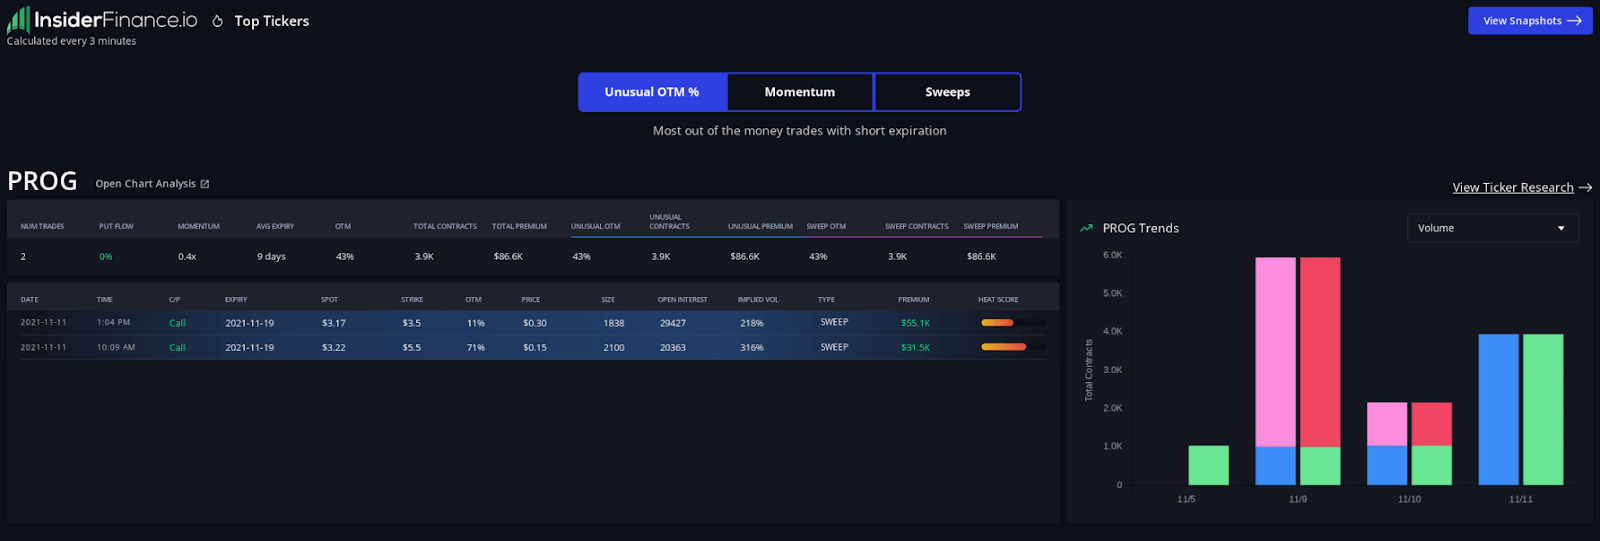
Why do we like it? We see repeated call activity and a trade with a high heat score.
We can’t trade blindly on that, though. The next step is validating the trade idea with technical analysis.
Validating the Trade Idea
Next, let’s check the technicals using the InsiderFinance automated technical analysis tools and set an alert if we don’t like them quite yet.
1-Hour Chart
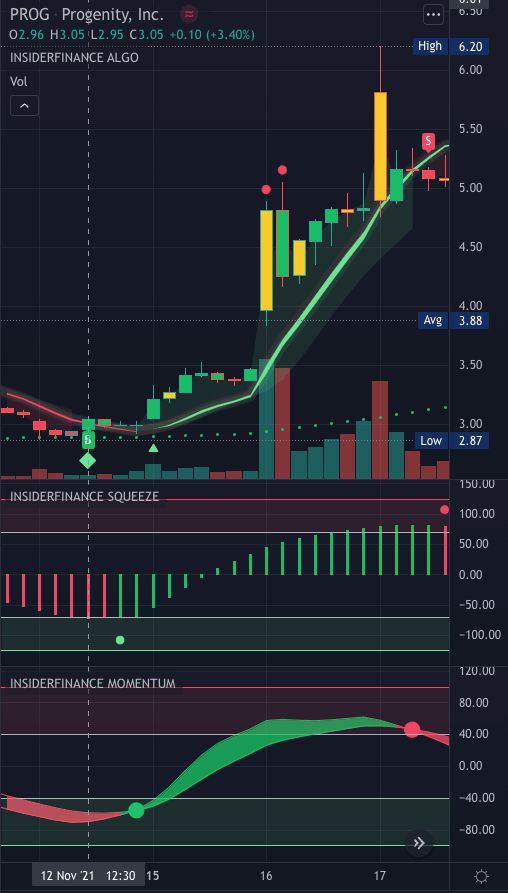
Notice that the initial bullish flow with a high heat score came in on 11/11 around 10 am, but we didn’t receive a Long Signal alert on the 1-hour chart until 11/12 at 12:30 pm.
This is what we mean when we say that Unusual Options Activity can take 1-3 days to play out.
You can see the Trend Reversal Diamond and Trend Confirmation Diamond very close to the Buy Signal.
A few bars later, we see a buy signal on the InsiderFinance Squeeze Indicator and InsiderFinance Momentum Indicator.
Assuming we don’t see any huge red flags on the Ticker Research page, we can consider trading, but you should always set a stop-loss.
Let’s check the 4-hour chart for the “long-term” trend.
4-Hour Chart
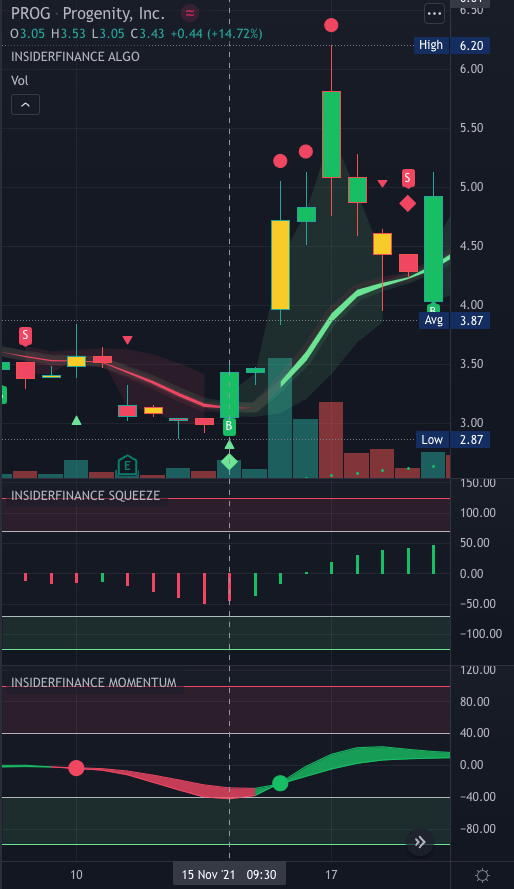
We don’t see a buy signal on the 4-hour chart until 11/15 at 9:30 am, but we see a very strong buy signal reinforced by a Trend Reversal Diamond and Trend Confirmation Triangle.
If we hadn’t entered the position before now, the long-term and short-term technicals would have been pretty compelling.
So what happened?
Trade Results
To recap, we spotted PROG as a Top Ticker on 11/11 and received our first alert for a buy signal on the 1-hour chart on 11/12 at 12:30 pm when PROG was trading below $3.
At the peak around 3 trading days later, PROG was trading over $6 for a 100% increase on the underlying ticker!
Since we traded the same options contract as Smart Money, we made a 400%+ profit in just 3 trading days from the Unusual Options Activity on PROG!
Find Unusual Options Activity Trade Ideas Using the Flow Dashboard
To identify high-potential tickers with unusual options activity, let’s set up filters to find Unusual trades with 95%+ Ticker Flow.
Tickers with close to 100% bullish or bearish flows mean smart money agrees on whether they think the price will go up or down.
By using this filter, we’ll only be looking at tickers where institutional traders are in agreement on short-term price action, which increases our chances of success.
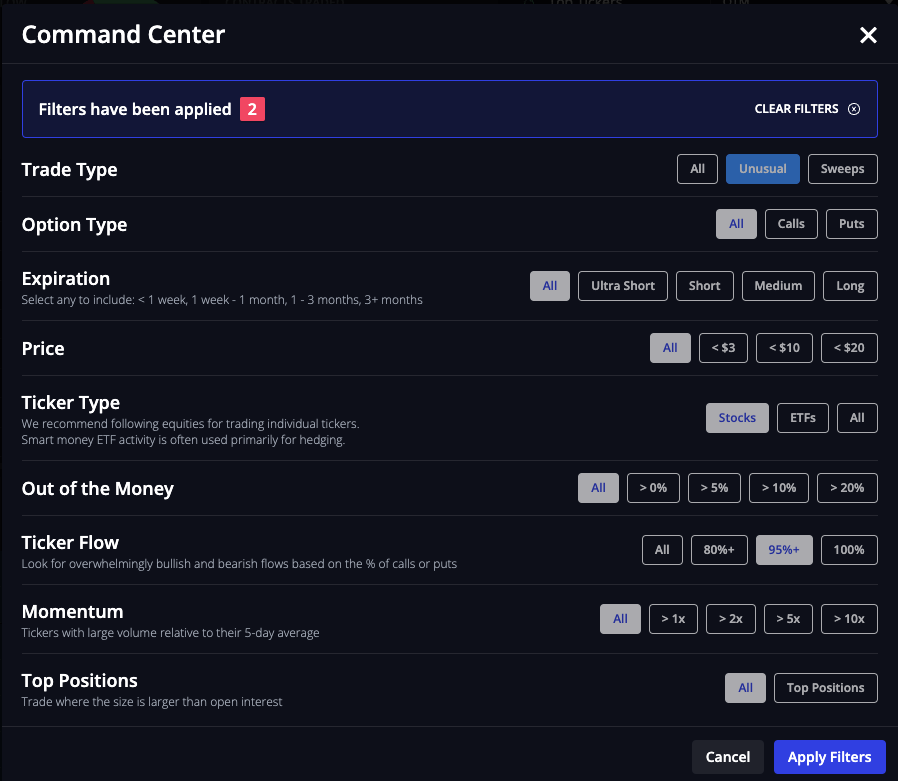
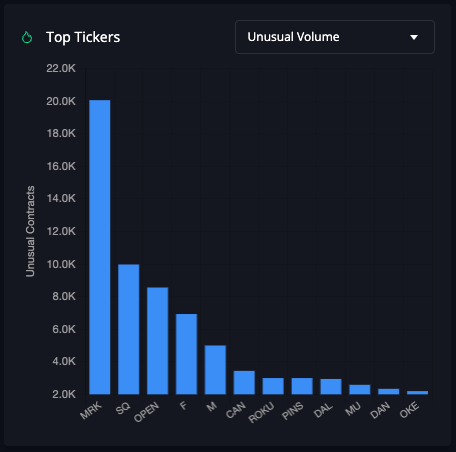
After we apply the filters, below is what the Top Tickers graph and Smart Market Insight by Ticker table look like when sorted by Unusual Volume.
When looking for good candidates, we typically check the table and graphs for Unusual OTM %, Unusual Volume, and Unusual Premium.
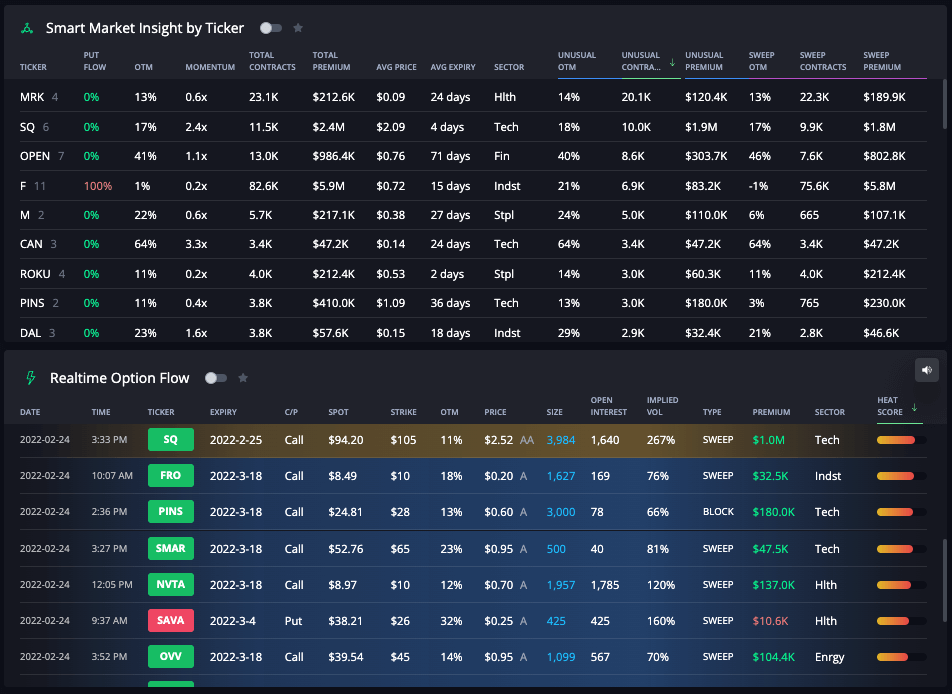
When deciding which tickers to research, you can narrow down the list by looking at the sector sentiment graphs and flows with high Heat Scores.
Wall Street expects the biggest price movements with the most “consensus” in sectors with the highest OTM % and overwhelmingly bullish or bearish premium flow.
Combined, these two graphs help you avoid trading “against the current.”
All ships rise with the tide, so it can be easier to trade a bullish position in a sector with almost all bullish flow.
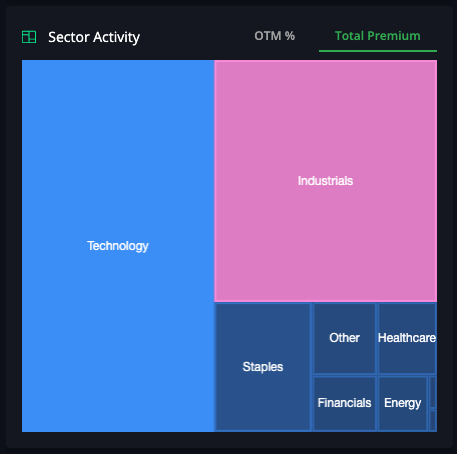
The graph above shows that the industrial sector has a bearish sentiment, while all other sectors have a bullish sentiment.
Based on the sector sentiment, we’d avoid Industrials but look for tickers in Technology (where the most premium is flowing) to increase our chances of success.
Validating the Trade Idea
After looking at a few different tickers with unusual options activity, SQ looks the most promising because the technology sector had bullish premium flow and high OTM %.
We also saw a Golden Sweep with a very high heat score, which is pretty compelling on its own.
The next step is to walk through why SQ stood out as a potential winner.
We first look for bullish options flow, dark pool activity, and breakout signals.
Options Flow
Because we filtered for tickers with 95%+ ticker flow, we already know we’ll see bullish option flow for the current trading day.
The question is how bullish are the flows, and do the dark pool prints tell the same story?
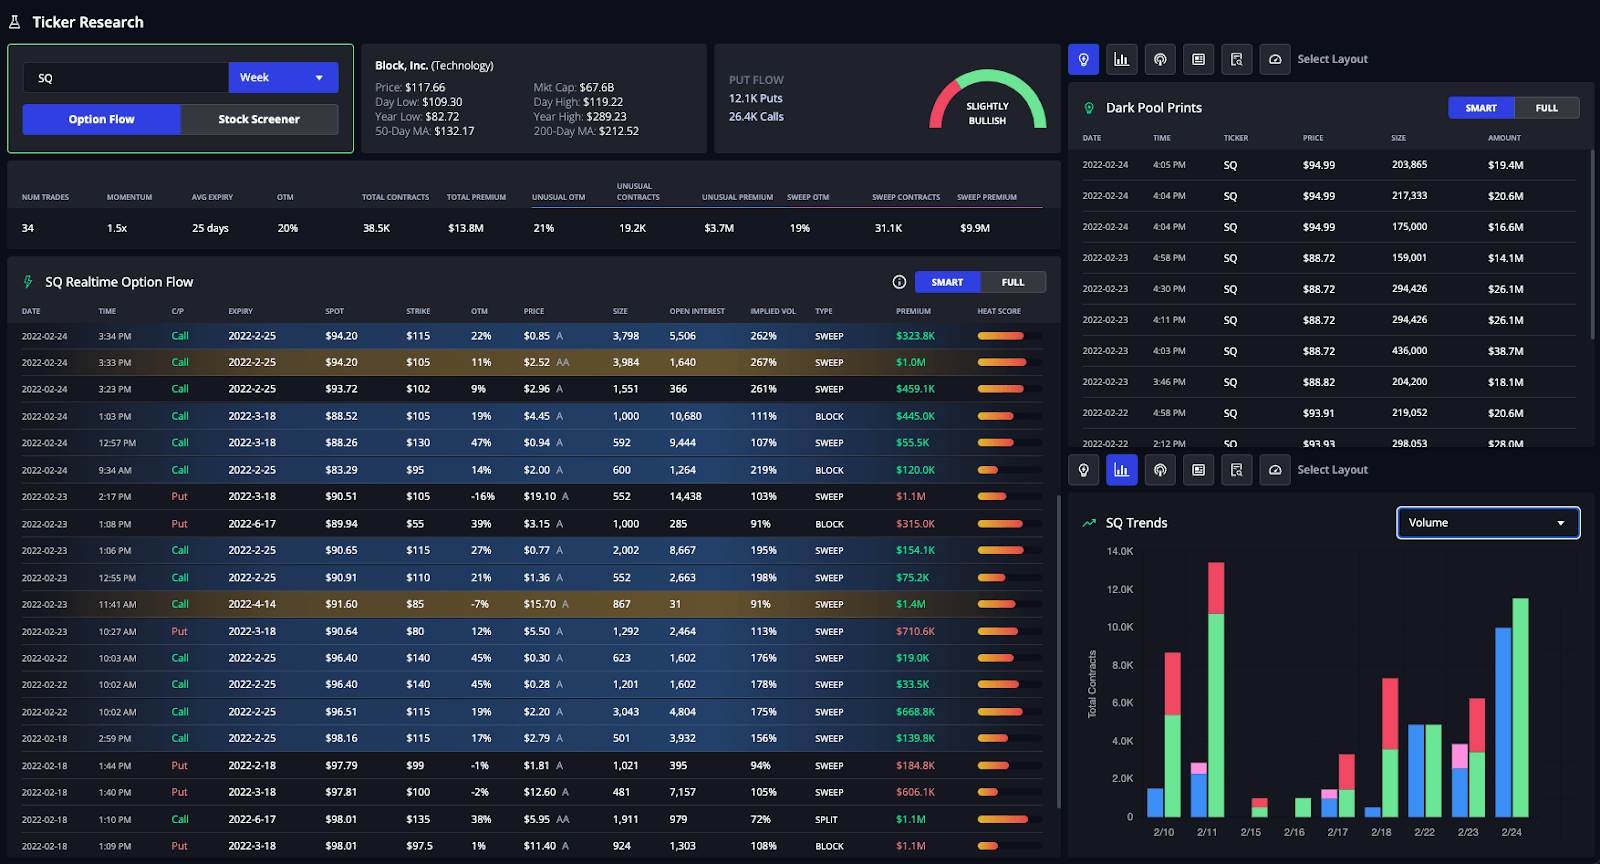
Two golden sweeps in two days for a ticker like SQ is very rare. That alone is a huge bullish sign.
Over the past two days, we have also seen multiple unusual contracts with high Heat Scores.
Looking at the week holistically, we see that Wall Street had mixed sentiments at the beginning of the week.
However, as time passed, the flows became increasingly bullish, with no bearish flows at all on the current trading day.
Given earnings are planned to be released the following day, it seems like smart money is finding out more as the week goes on and building big bullish positions.
After considering all those factors, we can conclude that the options flow seems very bullish.
Next, we want to check dark pool activity.
Dark Pool Prints
Quite a few dark pool prints have also come through in the last weeks, which is another bullish sign.
Finally, we want to check breakout signals.
Breakout Signals
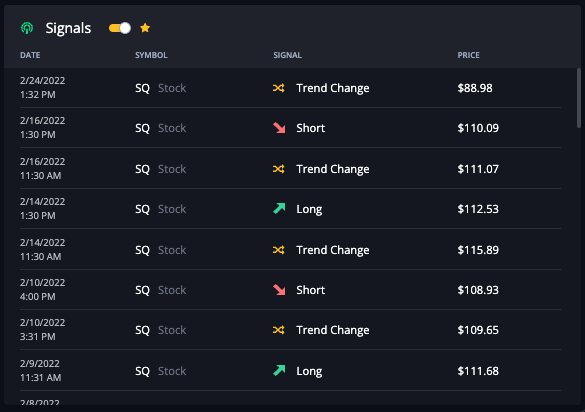
We see the last breakout signal generated was a buy signal, supporting our bullish thesis.
Both the options flow and dark pool show promising bullish activity supported by a bullish breakout signal, but we still need to analyze technical strength and news sentiment to confirm the bullish intent (and our entry).
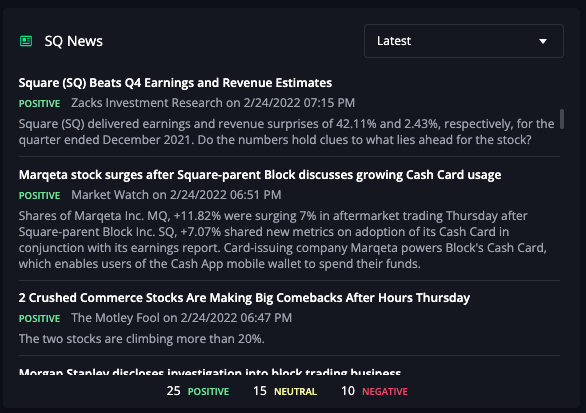
SQ has limited negative news sentiment and no alarming headlines that could be red flags, so we can still proceed with our analysis.
If we saw a lot of negative sentiment or questionable headlines, that could be enough to move on to another ticker.
Next, let’s examine technical analysis. When trading options, we tend to examine the 1-hour and 4-hour charts to get the "short-term" and "long-term" perspectives.
1-Hour Chart
We find that many unusual options trades also have strong technicals on the one-hour chart, which seems to be the time frame many institutions use to trade.
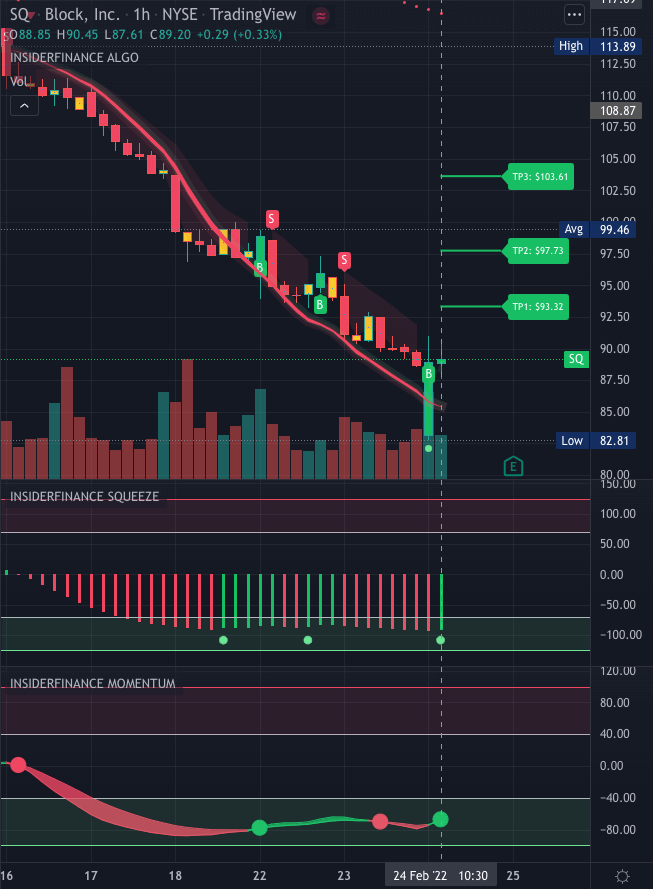
The 1-hour chart above seems to have pretty strong technicals.
The Algo is in a buy trend, and both the Momentum and Squeeze indicators also show buy signals.
Let’s see if the Technical Analysis widget agrees.
Technical Analysis Widget
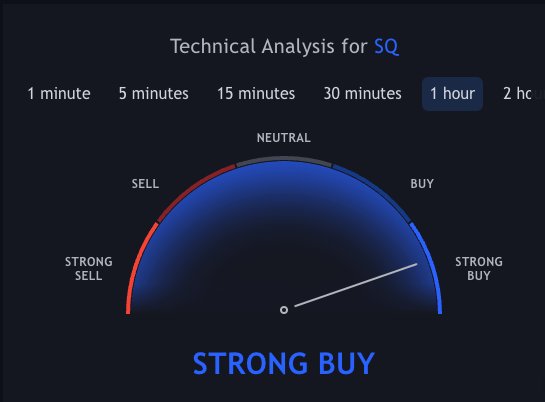
The Technical Analysis widget seems to agree with our charting tools, so we can conclude SQ has a pretty solid technical setup for the “short-term” outlook.
Let's see if we see the same on the 4-hour chart.
4-Hour Chart
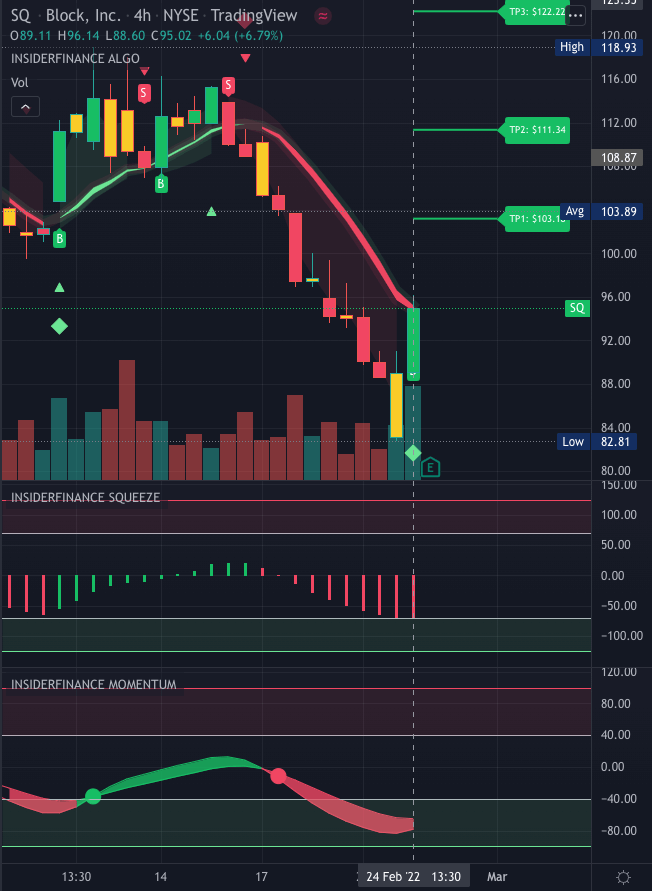
On the 4-hour chart, it seems like the Algo just changed to buy with a swing diamond, which is pretty strong confirmation on the InsiderFinance Algo.
Ideally, we would like to see a buy signal on both the InsiderFinance Squeeze and InsiderFinance Momentum. However, all the other data points confirming our bullish thesis might be enough.
Let’s see if the consensus on the widget agrees.
Technical Analysis Widget
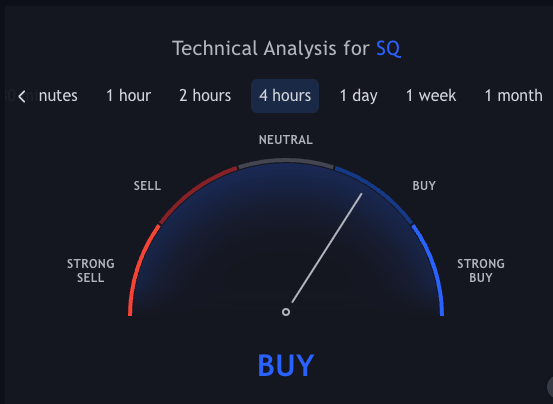
The Technical Analysis widget seems to agree with our charting tools, so we can conclude SQ has a pretty solid technical setup for its “long-term” outlook.
The combined data points are enough to interpret that the ticker is bullish, with institutions placing a highly leveraged bet on a positive earnings surprise.
This one seems worth entering, but we should definitely enter with a stop-loss, especially if we’re trading through earnings, which we typically don’t recommend.
There's always an element of unpredictability in the markets, so no matter how bullish a forecast looks, it's never guaranteed to play out.
That's where stop losses are key.
Implied Volatility
One last piece of advice we find very helpful when picking a contract is looking at implied volatility.
It's incredibly important for very short-term positions like day trading, as you're really just trading time value.
If implied volatility is too high, the contract will have a much harder time gaining value, as there is little "upside" left.
Implied vol is the main driver of intraday value and tends to "cap" at a certain level.
So, if the implied volatility is already close to that level, it doesn't have much room to rise.
This trade was obviously in the past, so what happened?
Trade Results
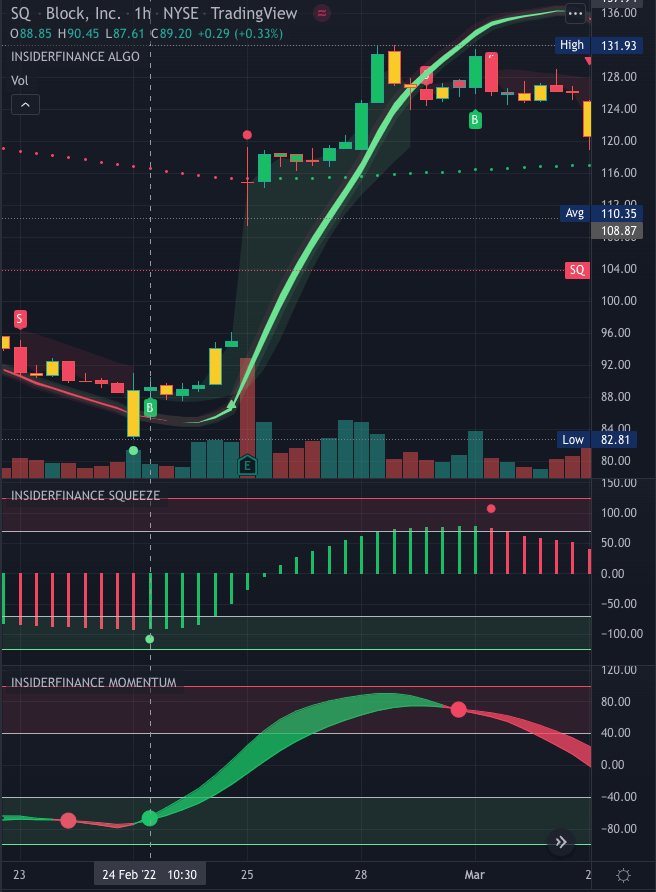
The ticker continued a bull trend over the next 3 trading days with a roughly 50% gain!
A 50% gain can be multiplied when trading options to potentially 500%+ returns.
After these examples, you’re ready to start trading the power of Unusual Options Activity!
Remember to set stop-losses and start with small amounts/paper trading, especially if this is your first time trading unusual options activity.
More Resources to Increase Your Returns Using InsiderFinance
Your success is our mission, and we’re committed to helping you master the service.
That’s why we created our FREE Masterclass, which teaches you everything you need to know to master the service completely for free.
Taught by our founders, these bite-sized lessons make it fast and easy for you to master trading with options + dark pool order flow supported by automated technical analysis.
We’re confident you’ll discover it’s the most powerful and intuitive resource for traders.
Here’s what’s included:
- InsiderFinance Overview
- New Member Checklist
- Your Complete Trading Toolkit
- Understanding Options Order Flow
- Small Options Flow as a Leading Indicator
- Understanding Dark Pools
- Using Option Flow + Dark Pool Together
- Automated Technical Analysis
- How to Find Winning Trades
- 3 Case Studies
We hope you use this free resource to increase your win rate!
Of course, our team is always available to help, so reach out if you need us!
HIGH POTENTIAL TRADES SENT DIRECTLY TO YOUR INBOX
Add your email to receive our free daily newsletter. No spam, unsubscribe anytime.


