Option Flow and Dark Pool: A Powerful Combination
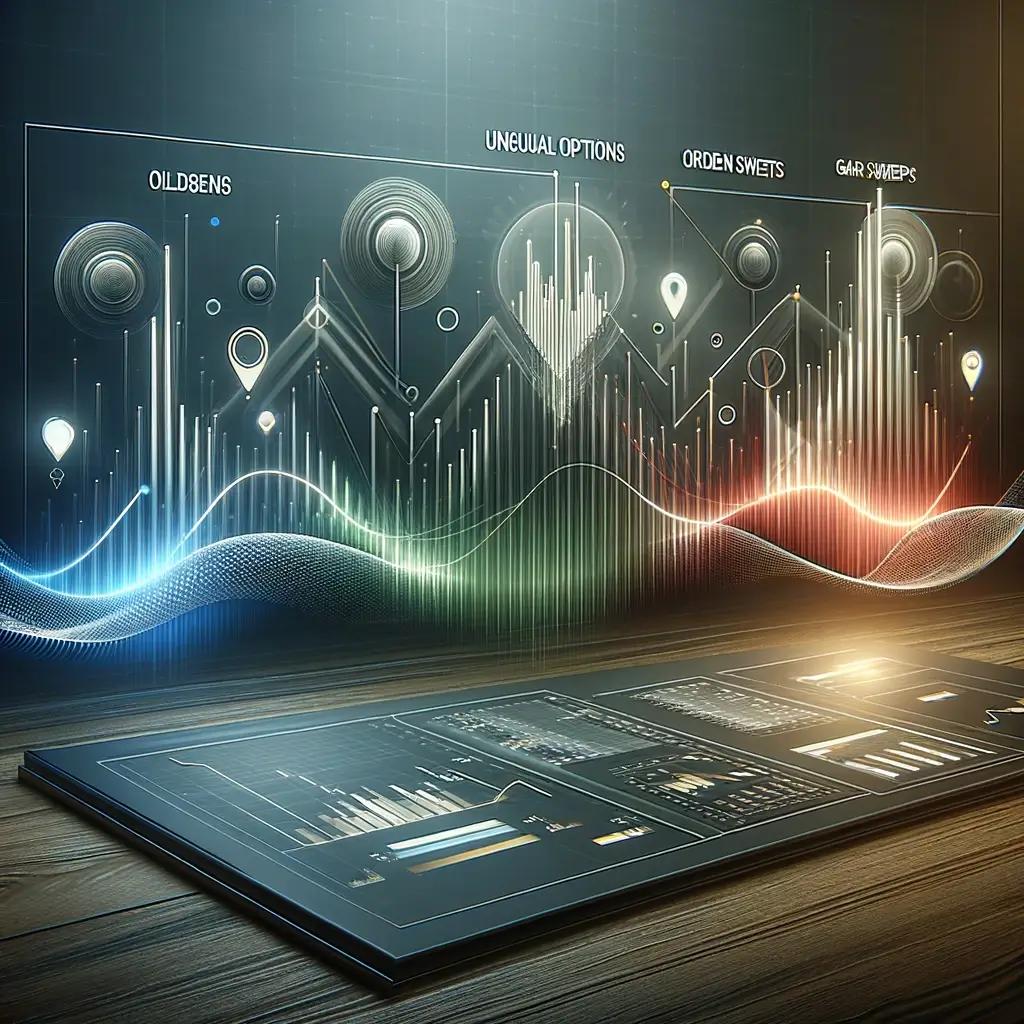
If you’ve never traded with option order flow or dark pool prints before, you’ve been trading blindly.
Option order flow is a strong leading indicator, and dark pool prints serve as support and resistance levels.
The powerful combination of option flow and dark pool helps traders determine market direction and increase the chance of success on every trade.
InsiderFinance intelligently identifies and highlights market-moving flow so you can gain an immediate trading advantage.
Options Flow
Option order flow is an excellent leading indicator of short-term market direction, and InsiderFinance brings the trades that matter front and center with built-in intelligence.
Below are some key definitions to help you interpret the flow:
Top Position
A contract where the contract size is greater than open interest on its own. The size text for these orders is highlighted in blue.

"Golden Sweep"
A sweep over $1M in premium that's also a top position. These characteristics imply urgency in execution, and golden sweeps typically determine short-term market direction.

Unusual Options Activity
A contract greater than or equal to 10% OTM with less than 35 days to expiry.

Order Side
The A means the trade was executed at Ask (i.e., offer or buy-side), and the AA means the trade was executed Above Ask.
If a trade was executed Above Ask, the buyer was very bullish on the trade and willing to pay extra to ensure he/she could enter it.
You could also view this as "aggressively" entering the position.

Heat Score
Our proprietary indicator of how aggressively a trade was executed (see our Heat Score article for additional detail).
You can sort for this to put aggressive trades front and center!

HIGH POTENTIAL TRADES SENT DIRECTLY TO YOUR INBOX
Add your email to receive our free daily newsletter. No spam, unsubscribe anytime.
Dark Pool Prints
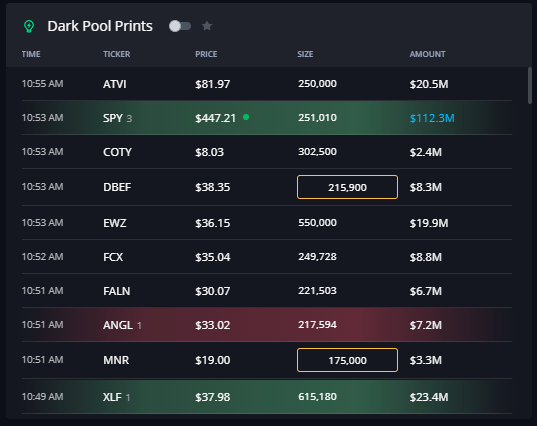
Dark Pool Prints help traders accurately identify support and resistance levels for a ticker, and InsiderFinance brings the trades that matter front and center with built-in intelligence.
Below are some key definitions to help you interpret the prints:
Late Buys and Sells
InsiderFinance highlights dark pool prints reported late. These are the trades that institutions make an extra effort to hide.
Dark pool prints traded below the open
Dark pool prints traded below the open of the current trade day are highlighted in green and imply bullish sentiment, which means an institution bought the stock before it increased in price the following day.
Late Buy -> Bullish Sentiment

Dark pool prints traded above the open
Dark pool prints traded above the open of the current trade day are highlighted in red and imply bearish sentiment, which means an institution sold the stock before its price decreased the following day.
Late Sell -> Bearish Sentiment

InsiderFinance provides added context for whether late trades on major indexes (SPY, QQQ, IWM, and DIA) were made with bullish sentiment or bearish sentiment.
We do this by showing red or green dots next to major index trades to identify whether the current spot price when the trade was reported is above or below where the index is currently trading for the day.
Late Buy + Green Dot → Bull Trend

Late Buy + Red Dot → Possible Bear Reversal

Late Sell + Red Dot → Bear Trend

Late Sell + Green Dot → Possible Bull Reversal

Unusually High Volume Orders
Dark pool prints where the block size is at or above 30% of the stock’s daily average volume can be particularly interesting and significant.
InsiderFinance makes these trades easy to spot with a gold box around the order size.

Large Premium Orders
Dark pool prints with a notional value above $50 million are also worth watching.
InsiderFinance makes these trades easy to spot with blue text on the notional amount.

Case Study: Golden Sweeps + Dark Pool Prints
To demonstrate the power of using options flow and dark pool prints together, we'll walk through a real example using TSLA. The concepts can be applied to any ticker.
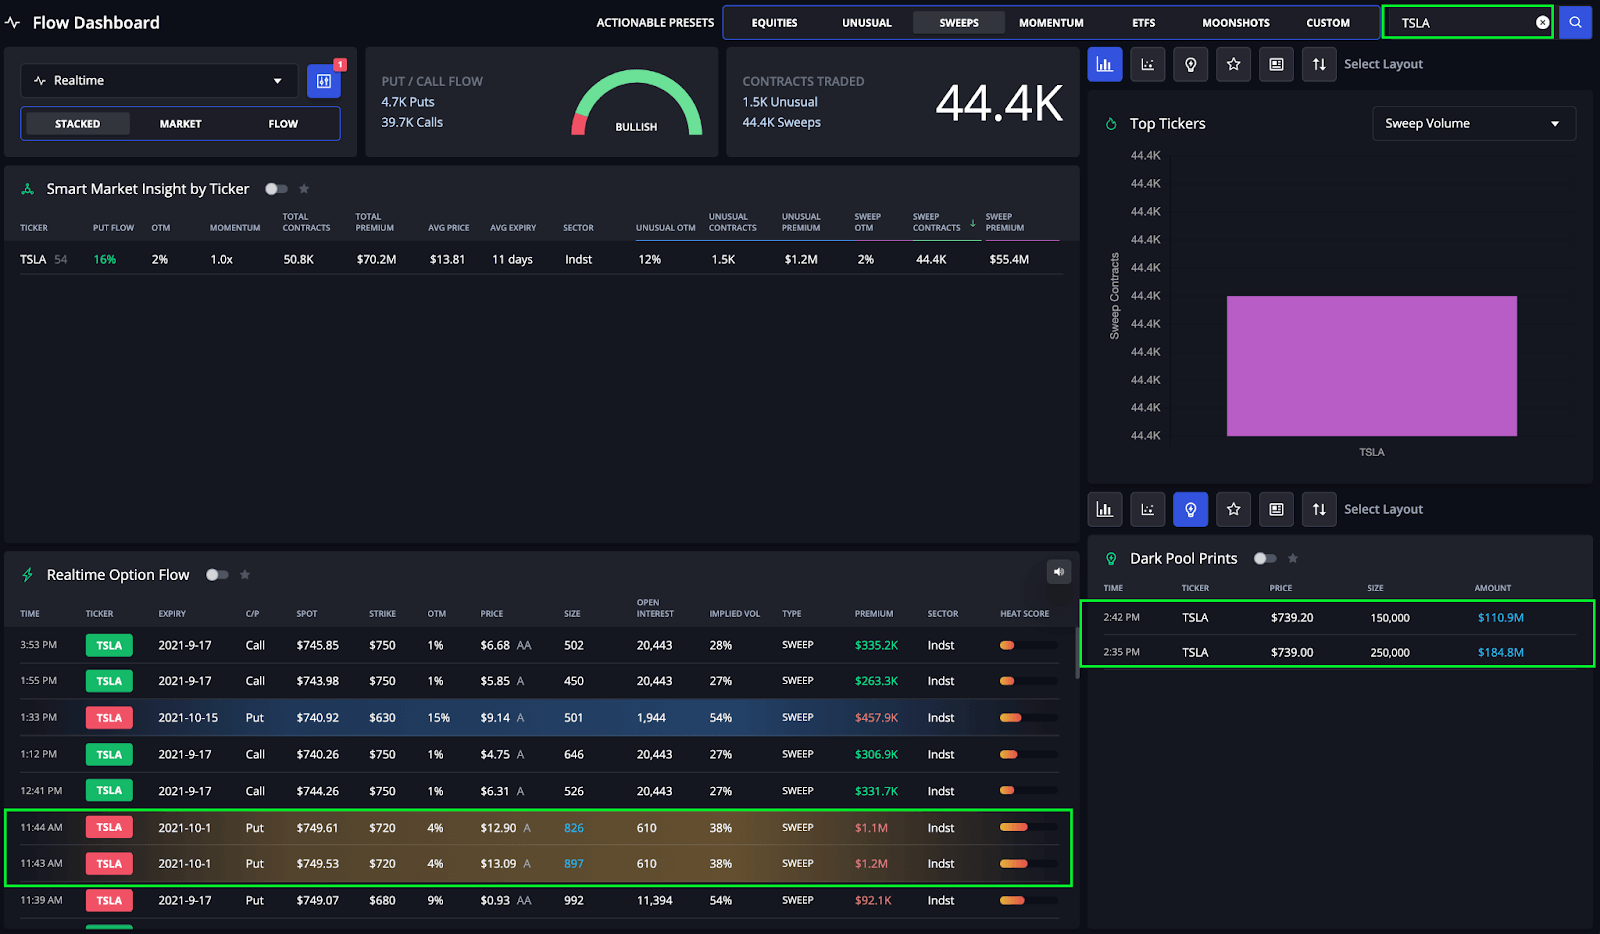
In the dashboard below filtered for TSLA, we see Golden Sweeps puts traded around 11:45 am, then Dark Pool prints with large premiums reported around 2:45 pm.
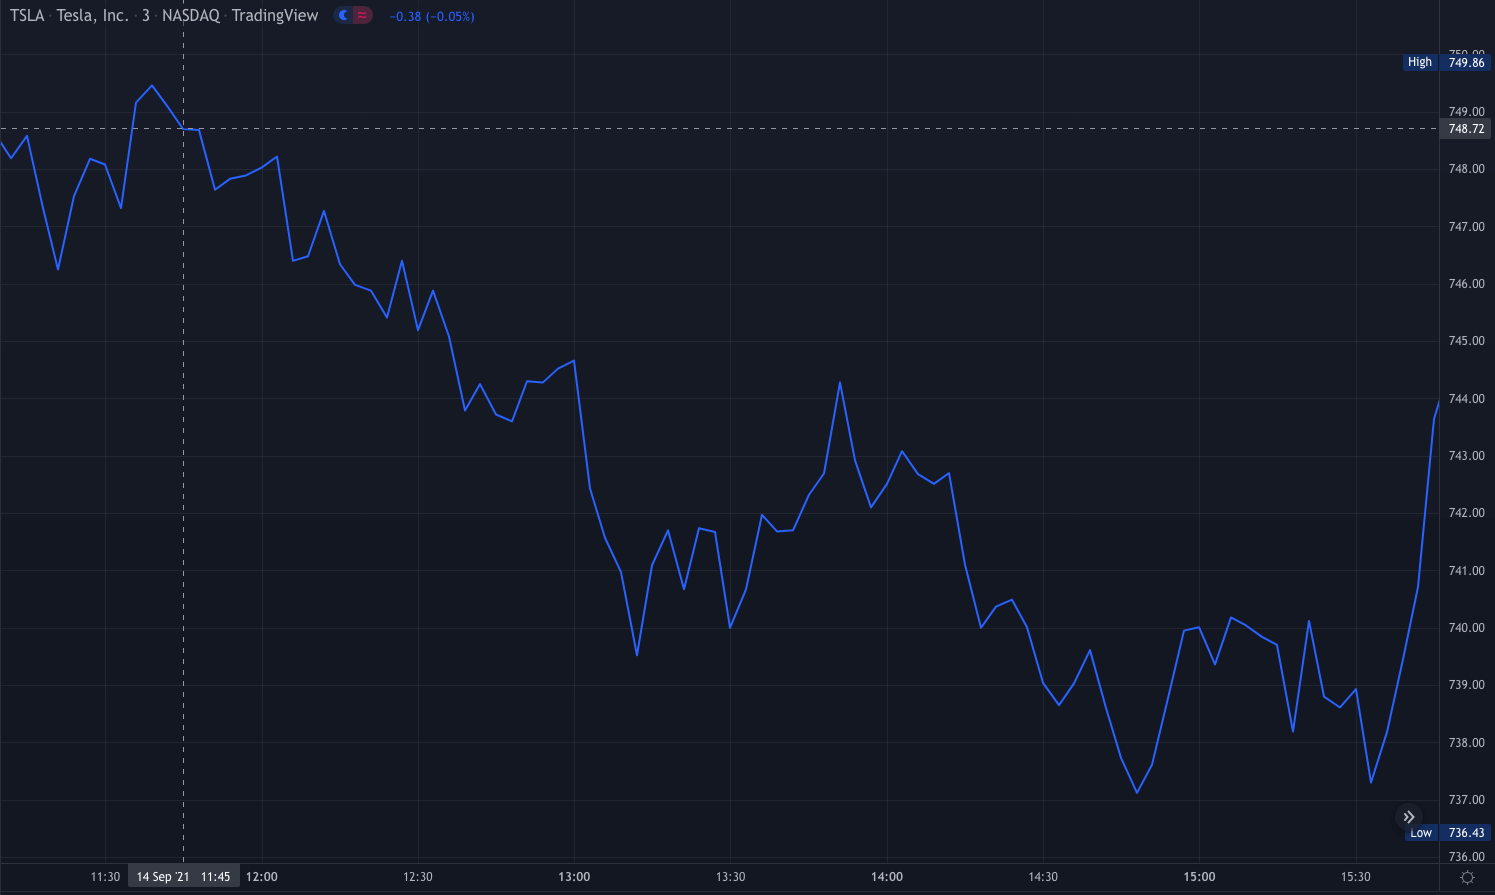
We'll then look at a chart to see how the trades impacted price action (keeping it simple and easy to read with line charts).
Golden Sweep Puts Start Downtrend
Shortly after the Golden Sweep puts come in, a downward trend starts on the chart shown below.
Dark Pool Prints Create Support
When the dark pool prints are reported around 2:45 pm, we see a support level form.
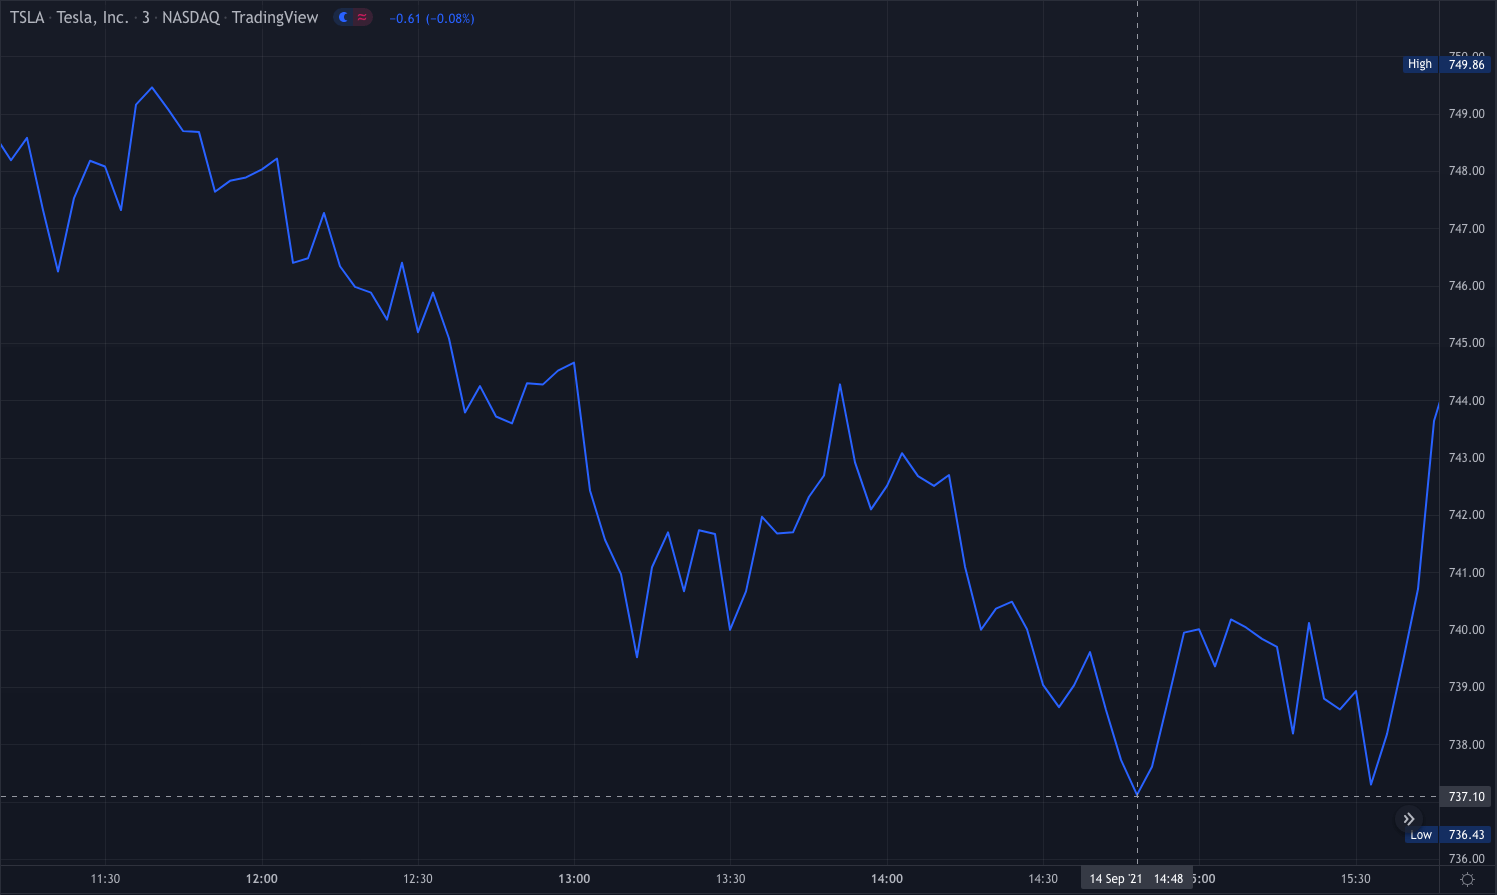
As you can see from the example above, options flow and dark pool make a powerful combination.
Of course, option flow and dark pool are only one piece of the puzzle, and you should always pull up a chart before entering a position.
Our automated technical analysis tools make validating trade decisions with technical analysis fast and easy.
HIGH POTENTIAL TRADES SENT DIRECTLY TO YOUR INBOX
Add your email to receive our free daily newsletter. No spam, unsubscribe anytime.


