Case Study: Golden Sweeps and Dark Pool Prints
To demonstrate the power of using options flow and dark pool prints together, we'll walk through a real example using TSLA. The concepts can be applied to any ticker.
In the dashboard below filtered for TSLA, we see Golden Sweeps puts traded around 11:45 am, then Dark Pool prints with large premiums reported around 2:45 pm.
We'll then look at a chart to see how the trades impacted price action (keeping it simple and easy to read with line charts).
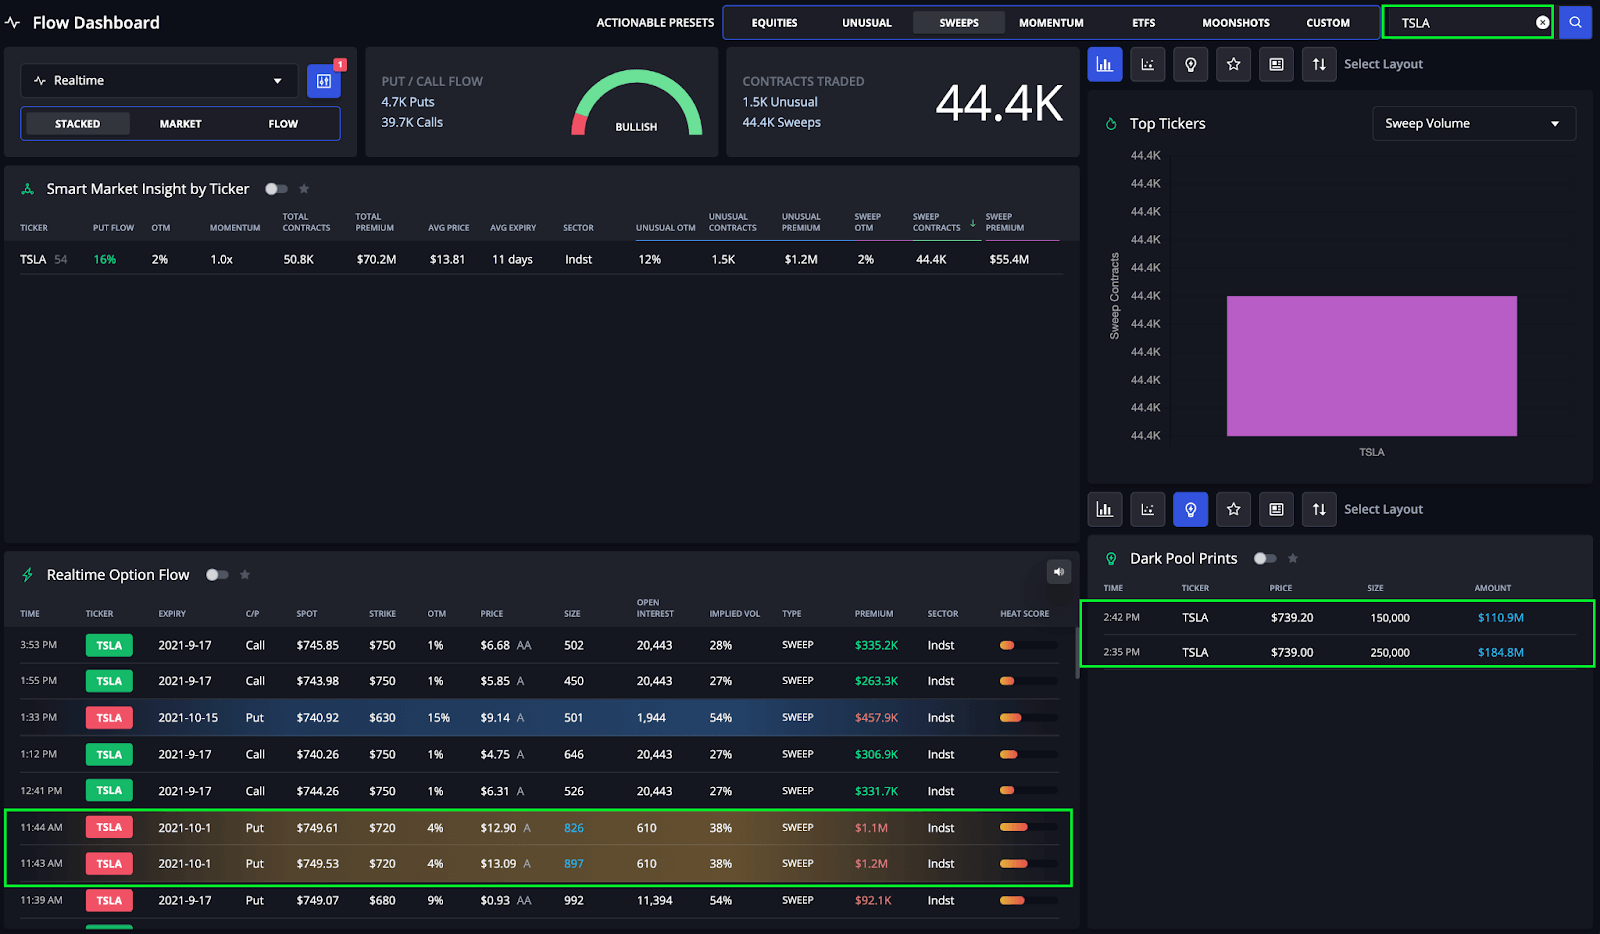
Golden Sweep Puts Start Downtrend
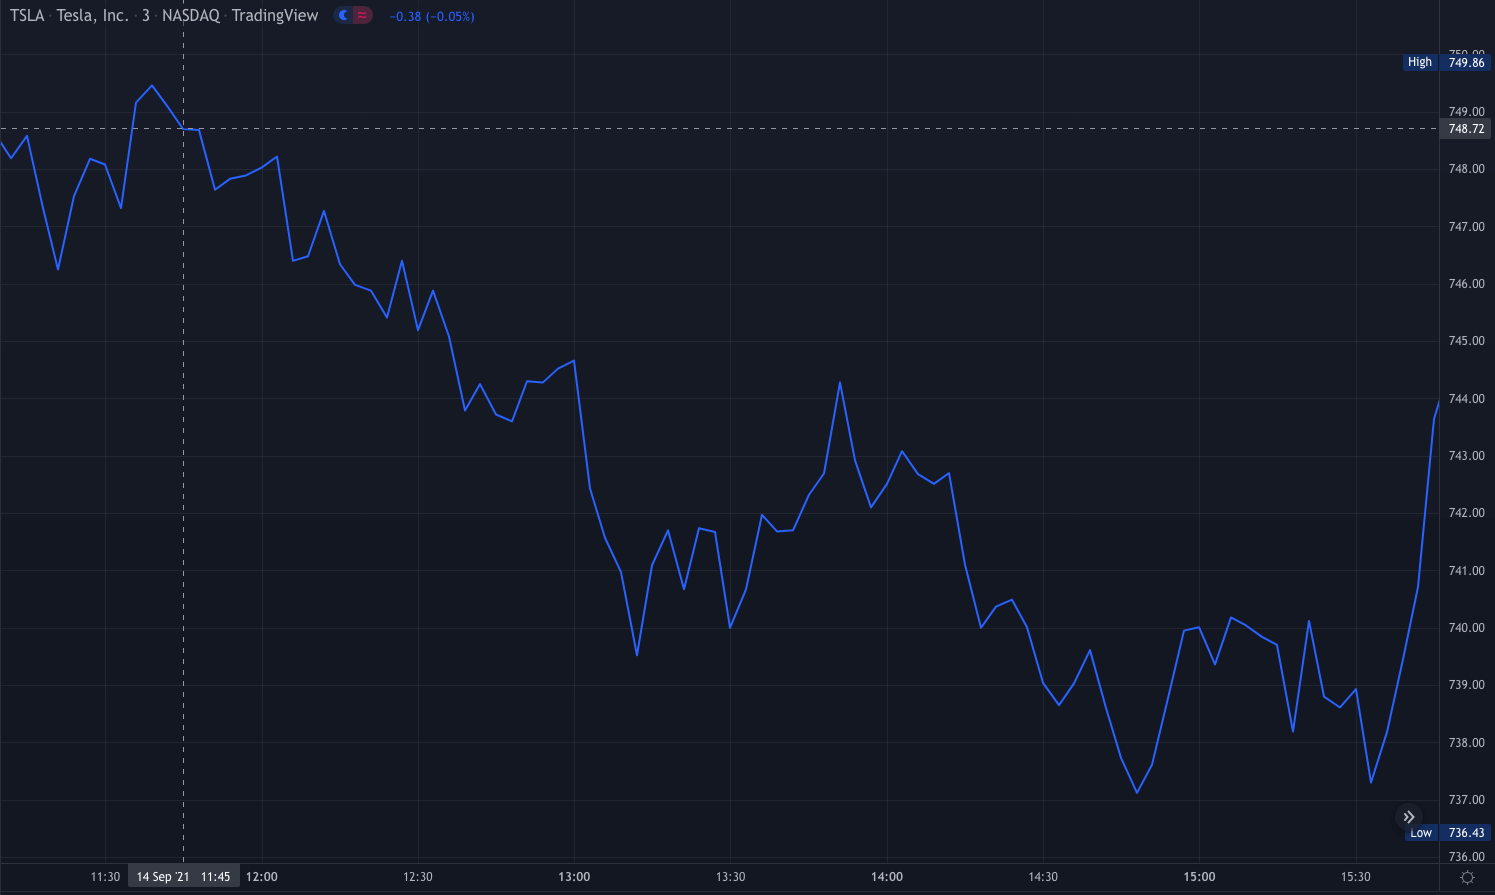
Shortly after the Golden Sweep puts come in, a downward trend starts on the chart shown below.
Dark Pool Prints Create Support
When the dark pool prints are reported around 2:45 pm, we see a support level form.
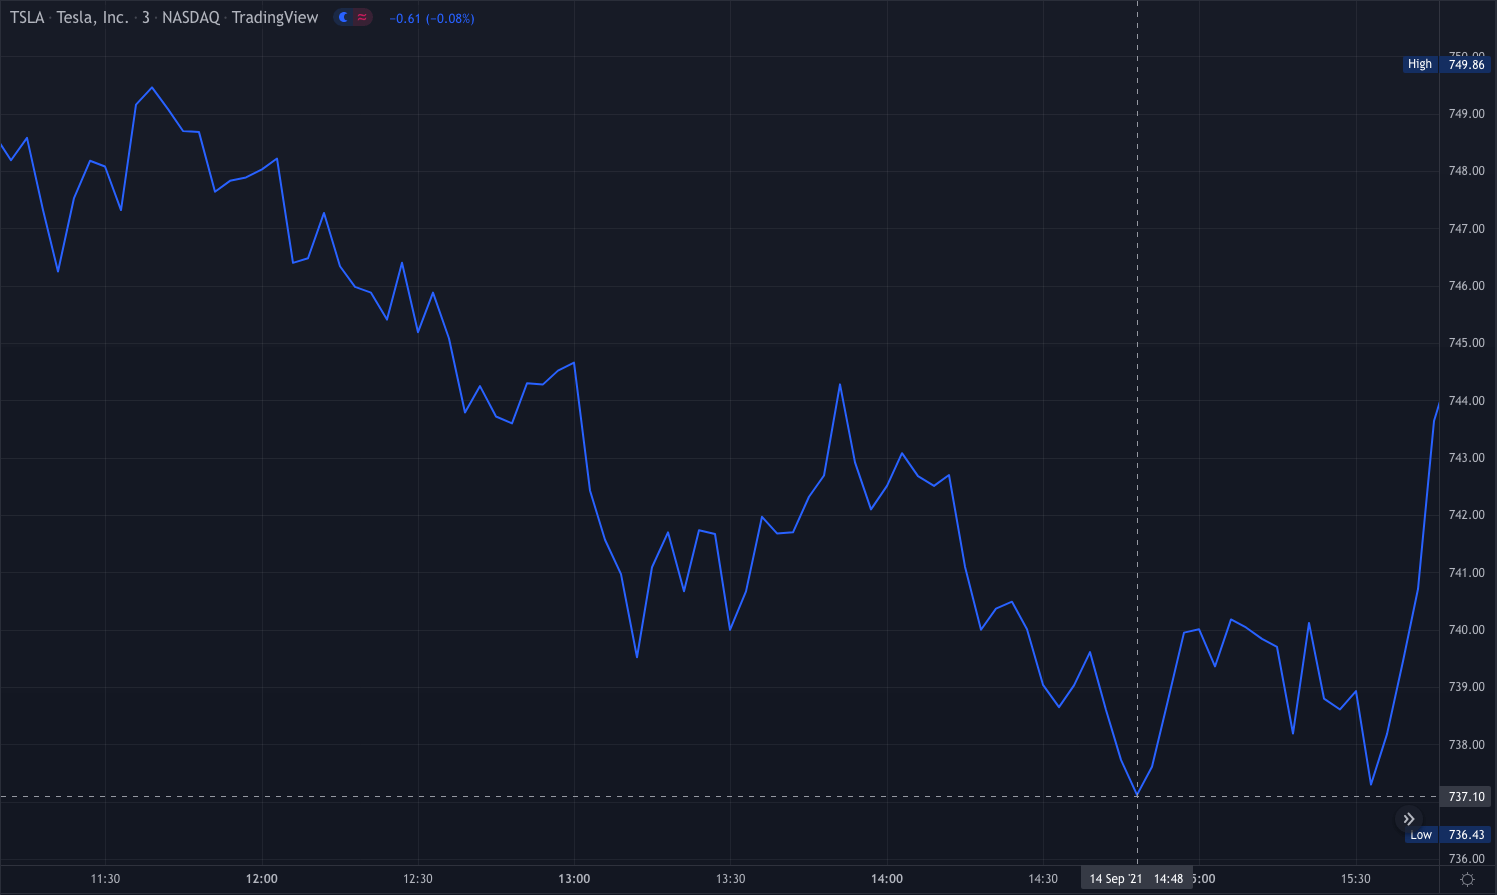
As you can see from the example above, options flow and dark pool make a powerful combination.
Of course, option flow and dark pool are only one piece of the puzzle, and you should always pull up a chart before entering a position.
Our automated technical analysis tools make validating trade decisions with technical analysis fast and easy.

