Automated Support and Resistance Levels

Support and resistance levels are critical decision points for traders. They help identify where price might reverse, break out, or consolidate.
Manually drawing these levels is time-consuming, subjective, and prone to error. InsiderFinance’s automated system removes the guesswork by identifying key price levels in real time.
How It Works
Our proprietary algorithm dynamically calculates and updates support and resistance levels based on real-time price action and historical volatility.
- Short-Term Levels – Best for quick, intraday trades
- Medium-Term Levels – Ideal for swing trading setups
- Long-Term Levels – Useful for broader trend analysis
The system highlights the strongest levels so traders can quickly see where institutional activity is likely.
How to Use It
- Spot key levels instantly without manual analysis
- Plan precise entries and exits based on market structure
- Trade with confidence knowing where price is likely to react
Your Edge
- React faster with real-time level updates
- Remove bias by trading based on data
- Increase accuracy by aligning with institutional price zones

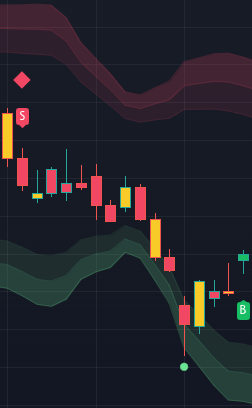
In addition to our automated support and resistance levels, the InsiderFinance also includes Bollinger Bands, a popular technical analysis tool that helps traders identify volatility and potential price reversals. The bands consist of three lines:
- Upper Band – Represents overbought conditions and potential resistance
- Middle Band (SMA) – A simple moving average that acts as a dynamic support or resistance level
- Lower Band – Represents oversold conditions and potential support
The bands expand when volatility increases and contract when volatility decreases, helping traders anticipate price movements.
How to Use Bollinger Bands for Support & Resistance
Bollinger Bands naturally act as dynamic support and resistance levels because price tends to stay within the bands. When price approaches the upper or lower band, traders look for a reversal or continuation.
- Reversal Signals: Price touching the upper band in a sideways market may indicate resistance, while touching the lower band may indicate support.
- Breakout Signals: A strong price move beyond the bands suggests a potential breakout, especially when combined with increased volume.
Using Bollinger Bands with InsiderFinance’s Support & Resistance Levels
When Bollinger Bands are used in combination with InsiderFinance’s automated support and resistance levels, traders can improve accuracy in identifying key price zones.
- If a resistance level aligns with the upper Bollinger Band, it strengthens the likelihood of a reversal.
- If a support level aligns with the lower Bollinger Band, it increases confidence in a bounce.
- When price breaks through a resistance level and the upper Bollinger Band, it suggests a stronger breakout.
- When price drops below support and the lower Bollinger Band, it signals a potential breakdown.
How This Helps Traders
- Confirms high-probability support and resistance levels
- Helps distinguish between false breakouts and true trend reversals
- Provides additional confidence in entry and exit points


