Guide to Options Flow and Dark Pool Tools
Intelligent Options Flow and Dark Pool
InsiderFinance offers the most powerful and intuitive options flow and dark pool dashboard publicly available. This guide explains what’s included and how to use our information to find winning trades.
InsiderFinance was created to solve a pervasive problem using order flow data: How do you know which contracts matter when you look at a raw list of trades?
Our platform provides a curated list of tradable information plus multiple data points and visuals so you can make better trade decisions faster and dramatically increase your chance of success on every trade using a data-driven approach.
The results speak for themselves. Our traders have found that our curated approach focused on actionable information saves hours of research daily and significantly increases their success rate.
So how do we accomplish this? It all starts with the data.
Underpinning the industry-leading InsiderFinance platform is a proprietary algorithm that intelligently processes and filters the options flow and dark pool prints to increase your probability of success.
Unlike other options order flow tools that use the same cookie-cutter data source and basic filtering, we start with the raw feed (i.e. 6M+ options contracts and 100M+ equity prints traded each day) and use proprietary processing and filtering, developed by a trained Wall Street quant, to only show you the trades that have the potential to be market-moving.
Combined with Heat Score, our proprietary indicator of how aggressively a trade was executed, our goal is to help you quickly identify market-moving trades without sorting through the noise.
Quality data is often the most under-appreciated element of any dashboard. Our algorithms do the heavy lifting for you, so you don’t have to spend hours filtering through distracting order flow.
While our focus is helping you save time through intelligent processing, we understand some traders would like to perform the analysis themselves.
That's why we made the full order flow available, so you have the best of both worlds: market-moving data and the full trade population.
Powerful Trading Tools
InsiderFinance is the most complete platform for retail traders to level the data advantage with institutions.
The platform was designed to be so simple and intuitive that traders of any skill level can use the tools and actionable insights we provide to make better and quicker data-driven decisions when trading any asset class.
The InsiderFinance platform comes with everything you need to trade faster and more confidently:
Options Order Flow and Dark Pool Dashboard
Traders get a live feed of the best smart money options and equity trades with intelligent highlighting for urgent and unusual activity.

Technical Analysis
InsiderFinance built a comprehensive and easy-to-use technical analysis system to accurately predict when to buy & sell stocks, options, crypto, forex, and futures.

High Potential Trade Ideas
InsiderFinance provides traders with real-time algorithmic trade ideas and breakout signals whose results have a proven track record.


Industry Leading Ticker Analysis
Traders can easily identify high-conviction chains with news sentiment, proprietary indicators, and trend analysis for individual tickers to validate trade ideas before entering.
InsiderFinance visualizes the recent sentiments, volumes, premium ticker trends, and news sentiment for the ticker.

One-Click Setups and Powerful Filters
Setting up your dashboard is easy with one-click setups that fit your style, or choose your own filters.

Custom Watchlist
Only care about activity from certain tickers? It’s easy to follow your favorite tickers with our Watchlist.
You can quickly filter the Smart Market Insight by Ticker, Real-Time Option Flow, or both.

Comprehensive Market Context
InsiderFinance provides advanced market context with intelligently processed data from 150+ premium sources, so traders no longer have to trade blindly.
All data is processed, so there is no need to dig through raw options flow or equity flow data. This saves traders a lot of time and gives them a solid foundation for research.

Powerful Visualizations
Advanced visualizations go beyond the essentials to help traders quickly find market and sector trends.
The dashboard has actionable graphs that allow traders to visualize the order flow and news feed easily, quickly identifying where the smart money is flowing and which side of the contract to bet on.

HIGH POTENTIAL TRADES SENT DIRECTLY TO YOUR INBOX
Add your email to receive our free daily newsletter. No spam, unsubscribe anytime.
Find High-Potential Trade Ideas
Finding trade ideas using InsiderFinance is easy! The platform was designed to provide multiple sources of curated trade ideas for any trading style.
Options Flow Top Tickers
InsiderFinance has multiple categories of Top Tickers on both the Flow Dashboard and the dedicated Top Tickers Page.
Flow Dashboard:
- Out of the Money (OTM)
- Unusual Out of the Money (OTM)
- Momentum
- Unusual Volume
- Unusual Premium
- Call Volume
- Call Premium
- Put Volume
- Put Premium
- Sweep Volume
- Sweep Premium

Top Tickers Page:
- Unusual Out of the Money (OTM)
- Momentum
- Sweeps
The Top Tickers page features tickers that are different from those on the Flow Dashboard. The main difference is that any ticker on the Top Tickers page has a strong “agreement” on the trade direction.
These signal categories fit different trading styles and different trade performances.
In our experience, Unusual trades tend to move the “slowest” (1-3 days to play out), and Momentum trades tend to move the “fastest” (often on the same day).
Dark Pool Top Tickers
InsiderFinance has multiple categories of Dark Pool Top Tickers on the Flow Dashboard:
- Premium
- Volume
- Late Buys (Bullish Sentiment)
- Late Sells (Bearish Sentiment)
- Golden Trades (Large Relative Volume)
- Sector Sentiment

Many members have had success adding their favorite top tickers to the watchlist and waiting to enter the trade when they show strong technical indicators.
We recommend using the technical analysis tools included with your subscription. You can even set custom alerts for any ticker on any time frame.
Breakout Signals
InsiderFinance generates breakout signals for stocks, crypto, and forex when multiple proprietary technical indicators show a similar pattern.
We display these signals within our dashboard on the Flow Dashboard and Ticker Research pages and send them to our Discord.
Each signal is backed by an elaborate series of proven indicators that all work together to give you the most accurate predictions possible based on market trends from multiple sources.
In other words, you receive a signal when our high-performing indicators are in confluence.
Most Researched Tickers
Find the next hot ticker with totally organic crowdsourced trade ideas from our community.

Smart Market Insight by Ticker
Institutional-grade order flow context, aggregated by ticker, helps you see the big picture and quickly find high-potential tickers.

Choose filters in the Command Center and sort by any column to bring the tickers that fit your trade style front and center, or try an Actionable Preset.
Tickers with close to 100% bullish or bearish flows mean smart money agrees on whether they think the price will go up or down.
Validate Trade Ideas to Confirm Entry
Once you have your trade idea, our industry-leading ticker research page has powerful visuals and analysis to validate your trade decision confidently and quickly.
Intelligent Order Flow
Trade with the flow, not against it.
The Smart Feed is the default feed for InsiderFinance. We use our proprietary algorithm to display high conviction options trades and dark pool prints to drastically reduce noise, making it easier to make decisions.
Our proprietary Heat Score indicator shows you how aggressively a trade was executed.
Combined, you’ll have a clear picture of how bullish or bearish institutions are on a ticker, so you’re never trading against the large orders that drive price action.
The Smart Feed is designed to save you time through intelligent processing, but we understand some traders would like to perform the analysis themselves.
That's why we made the full order flow available, so you have the best of both worlds: market-moving data and the full trade population.
If you're interested in seeing more trades, you can use the Full Feed preset to display all trades for a ticker above a premium threshold for both options flow and dark pool.

Trend Analysis
Powerful graphs make trend analysis fast and easy.
You can quickly see volume and premium trends for options flow and unusual activity over the past two weeks to determine institutional sentiment, or you can view institutional expiry distributions for calls and puts to help you determine your expected trade time frame.

Typically, institutions build a position with longer expirations first and layer in shorter expirations (or the same expiration but days/weeks later) once they become more confident.
So, if you see a lot of long expirations, it likely means institutions are just starting to build a position in a ticker.
Shorter expirations could mean the institutions think a more immediate movement is imminent.
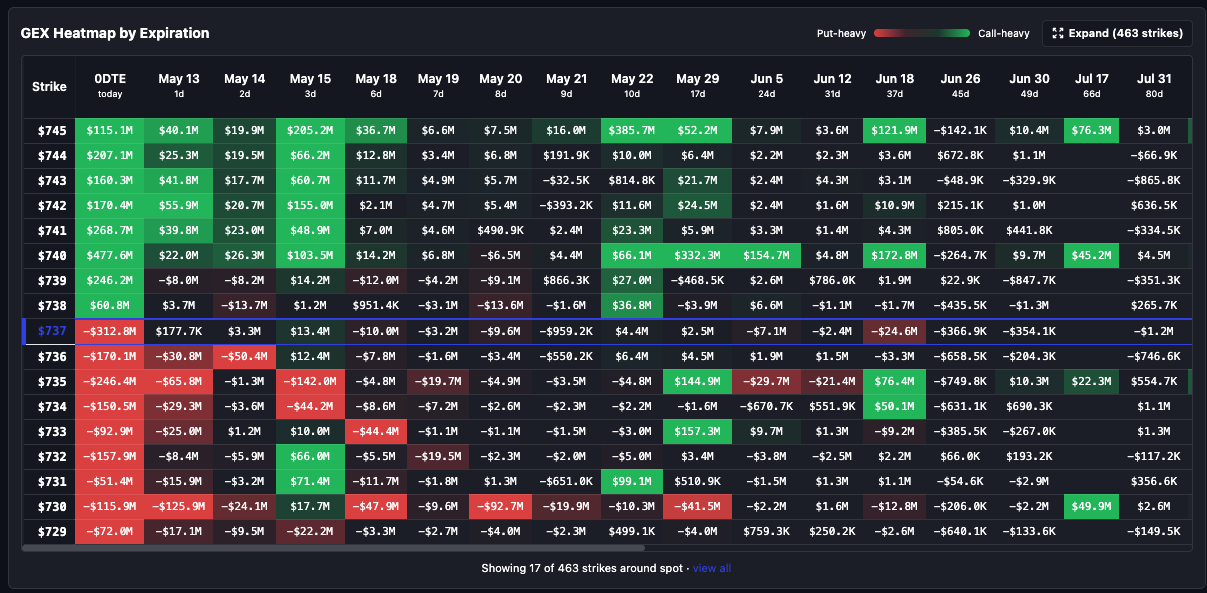
Dark Pool Levels
Tracking the price level that dark pool prints are trading over time helps identify support and resistance levels.

If a ticker is trading down, identifying large dark pool print accumulations below the current price will uncover support levels where a reversal may occur.
The more volume that was transacted at that price, the stronger the support level is likely to be.
The same is true for large accumulations above the current price.
The price with the most volume accumulated can signal the resistance level at which the ticker may consolidate and reverse down.
News Sentiment
News from 150+ premium sources is analyzed for sentiment, so you will never miss big news that drives price action again.
Sentiment is aggregated for each ticker, so you can see the number of positive, negative, and neutral news mentions each ticker has.

News can be a large driver of short-term price action, and InsiderFinance’s news sentiment helps you quickly determine the sentiment of the latest or trending news before you trade.
Breakout Signals
Breakout signals can be used to find and validate trade ideas.
For example, if you see a short signal generated for a ticker you were thinking about taking a long position in, you may want to wait until the technicals improve to enter.

You should pull up a chart and investigate further before trading in the described situation.
Technical Analysis
High-potential trade ideas have a much higher chance of success when supported by strong technical analysis.
We offer two ways to determine technical support quickly: our proprietary charting tool and a technical analysis widget.
Our automated technical analysis system eliminates the guesswork involved in finding winning chart setups and optimal trade entries/exits that maximize every trade's returns, making technical analysis easy to understand and use immediately.
Plus, it’s free with your subscription.

The technical analysis widget makes it easy to determine how bullish or bearish technical indicators are at each time frame interval.
These can be very useful for identifying short-term trends vs long-term trends.

For example, on a 1-5 day swing trade, you can check the 4-hour interval for the long-term trend and the 1-hour interval for the short-term trend.
If you see the 4-hour trend is bearish, but the 1-hour trend is bullish, that means short-term price action is likely to be bullish but could be met with resistance as the longer-term trend is still bearish.
Financial Information
Technical analysis tends to drive short-term price action, but tickers with strong fundamentals tend to outperform those with weak fundamentals, even in the short term.
That’s why we included key financial information so you can quickly scan the fundamentals before trading.

The more confirmations you have before entering a trade, the greater the likelihood of success.
However, you should still consider placing a stop loss for your trade, as even the most promising trades can be impacted by market conditions.
Example Analysis
Now that you know all the different tools available to find and validate trade ideas, let’s walk through an end-to-end example of how to choose a winning trade with InsiderFinance.
We’ll be looking for tickers with as many bullish data points as possible to increase our likelihood of success on the trade.
This example analysis follows the same process in our 3 Steps to Trade article.
At a high level, we’re using the tools in the Find High-Potential Trade Ideas section to identify a trade idea and the tools in the Validate Trade Ideas to Confirm Entry section to validate whether we should enter the trade.
We’ll focus on finding a trade idea using unusual options activity, but there are many ways to identify trade ideas depending on your trading style (using the same general process).
In our experience, unusual options trades tend to move the “slowest” (1-3 days to play out), so there’s more time to research and time for a good entry.
One strategy we’ve heard from other members (and that we also use ourselves) is setting up TradingView alerts for good candidates on the 1-hour chart and entering a position when the technicals look good.
That’s what we’ll focus on here as well.
Finding a Trade Idea
To identify high-potential tickers with unusual options activity, let’s set up filters to find Unusual trades with 95%+ Ticker Flow.
Filtering the Options Flow
Tickers with close to 100% bullish or bearish flows mean smart money agrees on whether they think the price will go up or down.
By using this filter, we’ll only be looking at tickers where institutional traders are in agreement on short-term price action, which increases our chances of success.

After we apply the filters, below is what the Top Tickers graph and Smart Market Insight by Ticker table look like when sorted by Unusual Volume.
Find Top Tickers
When looking for good candidates, we typically check the table and graphs for Unusual OTM %, Unusual Volume, and Unusual Premium.


When deciding which tickers to research, you can narrow down the list by looking at the sector sentiment graphs.
Sector Sentiment
Wall Street expects the biggest price movements with the most “consensus” in sectors with the highest OTM % and overwhelmingly bullish or bearish premium flow.
Combined, these two graphs help you avoid trading “against the current.”
All ships rise with the tide, so it can be easier to trade a bullish position in a sector with almost all bullish flow.
The graph below shows that the technology sector has mixed sentiment, the energy sector has bearish sentiment, and all other sectors have bullish sentiment.
Based on the sector sentiment, we’d avoid technology and energy tickers to increase our chances of success.

Validating the Trade Idea
After looking at a few different tickers with unusual options activity, HTA looks the most promising because the Staples sector had bullish premium flow and high OTM %.
The next step is to walk through why HTA stood out as a potential winner.
We first look for bullish options flow and dark pool activity.
Bullish Options Flow
We already know we'll see bullish option flow because we filtered for tickers with 95%+ ticker flow.
The question is how bullish are the flows, and do the dark pool prints tell the same story?

The two large call options in the past two weeks are certainly promising, especially for a ticker like HTA, which typically doesn't see substantial institutional volume.
The size of the premiums, given the low trading volume and the very high heat score, suggests that the options flow is very bullish.
Next, we want to check dark pool activity.
Dark Pool Prints
There seem to be quite a few dark pool prints that have come through in the last two weeks also, some of which were very large (hence the gold box).
Both the options flow and dark pool show promising bullish activity, but we still need to analyze technical strength and news sentiment to confirm the bullish intent (and our entry).
News Sentiment
HTA has no negative news sentiment or alarming headlines that could be red flags, so we can still proceed with our analysis.
If we saw a lot of negative sentiment or questionable headlines, that could be enough to move on to another ticker.

Next, let’s look at technical analysis.
Technical Analysis
When trading options, we tend to look at the 1-hour and 4-hour charts to gain the "short-term" and "long-term" perspectives.
We find that many unusual options trades also have strong technicals on the 1-hour chart, which seems to be the time frame many institutions use to trade.
1-Hour Chart

The 1-hour chart above seems to have pretty strong technicals.
The Algorithm is in a buy trend. The swing diamond and trend triangle confirm the trend, and both the Momentum and Squeeze indicators also show buy signals.
Technical Analysis Widget

The Technical Analysis widget seems to agree with our charting tools, so we can conclude that HTA has a pretty solid technical setup for the “short-term” outlook.
4-Hour Chart
Let's see if we see the same on the 4-hour chart.

On the 4-hour chart, it seems like the Algo just changed to buy with a swing diamond, and the Squeeze is showing a buy signal.
Now that we've seen most of the confirmations we typically look for, let’s see if the consensus on the widget agrees.
Technical Analysis Widget

The Technical Analysis widget seems to agree with our charting tools, so we can conclude that HTA has a pretty solid technical setup for its “long-term” outlook.
The combined data points are enough to interpret that the ticker is bullish with institutions trying to trade a short-term uptrend quickly.
Trade with a Stop Loss
This one seems worth entering, but we should definitely enter with a stop loss due to the amount of movement that has already occurred.
There's always an element of unpredictability in the markets, so no matter how bullish a trend looks, it's never guaranteed to play out. That's where stop losses are key.
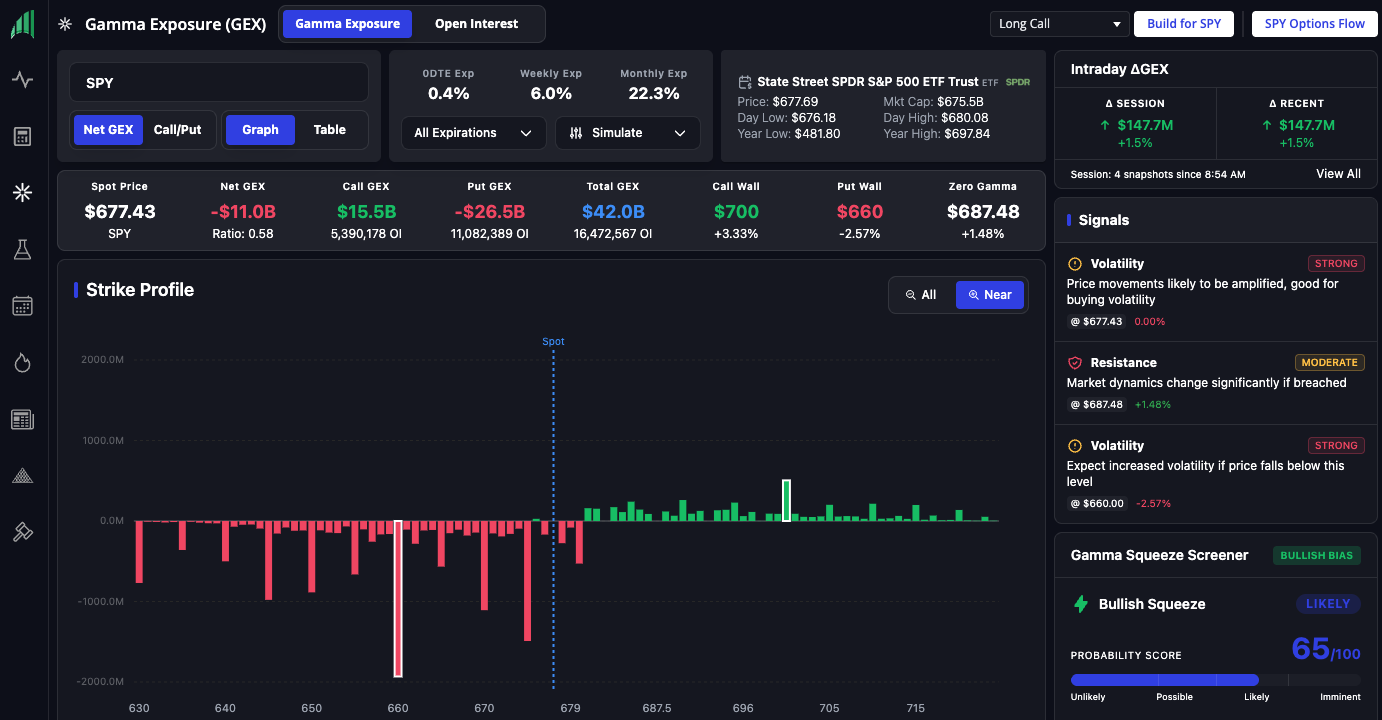
Implied Volatility
One last piece of advice we find very helpful when picking a contract is looking at implied volatility.
It's incredibly important for very short-term positions like day trading, as you're really just trading time value.
If implied volatility is too high, the contract will have a much harder time gaining value, as there is little "upside" left.
Implied vol is the main driver of intraday value and tends to "cap" at a certain level.
So, if the implied volatility is already close to that level, it doesn't have much room to rise.
This trade was obviously in the past, so what happened?
Trade Results
The ticker continued a bull trend over the next 3 trading days with a roughly 10% gain.
A 10% gain can be multiplied when trading options to potentially 100%+ returns.
Hopefully this walkthrough teaches you how to do the same!
Remember to set stop losses and start with small amounts/paper trading, especially if this is your first time trading unusual options activity.
Signs to Take Profits
Now that you have seen what to look for when entering a position, let’s discuss when you might want to consider taking profits.
We typically look for two main signs to exit a long position: very bearish order flow or a change in technicals, whichever comes first.
To spot the change in order flow, make sure to add the ticker to your watchlist.
If you start to see repeated bear activity, especially with large volumes or premiums, it may be a sign that the uptrend is over.
Our technical analysis system comes with everything you need to identify a change in technicals and time the perfect exit:
Take Profit & Stop Loss Levels
- Three take profit levels and a stop loss level are automatically generated for each buy/sell signal.
- If your trade goes below the stop loss level or above any of the take profit levels, that’s typically a good time to consider taking profits or cutting your losses.
Caution Candles and Dots
- Yellow candles and caution dots can indicate the current trend is slowing down or changing.
- If you start to see multiple yellow candles or caution dots, that’s typically a good time to consider taking profits or cutting your losses.
Trend Changes
- Signs of an opposite trend or a change in trend are worth evaluating.
- For example, if you’re in a long position, consider taking profits or exiting a position when you see sell signals, bear caution dots, or bear trend reversal diamonds.
- If you’re in a short position, consider taking profits or exiting a position when you see buy signals, bull caution dots, or bull trend reversal diamonds.
Look for the above signals to determine the best time to take profits or exit a position.
Remember to stick to your trade plan and keep emotion out of the process.
More Resources to Increase Your Returns Using InsiderFinance
Your success is our mission, and we're committed to helping you master the service.
We’re actively adding more resources but wanted to share a few we have available:
Our 3 Steps to Trade article captures our typical routine to identify trade opportunities.
In general, the more data points you have supporting a trade idea, the higher the probability of success.
Our Videos and Walkthroughs from Real Traders Using InsiderFinance articles contain high-quality resources from our content partners to help you master our service.
We wrote our Advice for New Members article after one of our members reached out about having trouble using the information.
We gave him some suggestions on educational content, and he upgraded to an annual subscription.
We asked specifically what made the difference for him and if we could share his experience with other members, which he was happy to let us.
Of course, our team is always available to help, so reach out if you need us!
HIGH POTENTIAL TRADES SENT DIRECTLY TO YOUR INBOX
Add your email to receive our free daily newsletter. No spam, unsubscribe anytime.