How to Find Trade Ideas with Top Tickers

Powerful Trading Tools
InsiderFinance offers retail traders the most powerful and complete platform to level the data advantage with institutions.
The platform was designed to be so simple and intuitive that traders of any skill level can use the tools and actionable insights we provide to make better and quicker data-driven decisions when trading any asset class.
Our platform provides a curated list of tradable information plus multiple data points and visuals so you can make better trade decisions faster and dramatically increase your chance of success on every trade using a data-driven approach.
The results speak for themselves. Our traders have found that our curated approach focused on actionable information saves hours of research daily and significantly increases their success rate.
So how do we accomplish this? Underpinning the industry-leading InsiderFinance platform are proprietary algorithms, developed by a trained Wall Street quant, that intelligently identify high-power options order flow and dark pool prints to increase your probability of success.
Our advanced algorithms do the heavy lifting behind the scenes to bring you high-potential trade ideas whose results have a proven track record without spending hours digging through distracting order flow.
We call these high-potential trade ideas Top Tickers, and this guide explains how to find winning trades using our Top Tickers.
Find High-Potential Trade Ideas with Top Tickers
Finding trade ideas using InsiderFinance is easy! The platform was designed to provide multiple sources of curated trade ideas for any trading style.
Options Flow Top Tickers
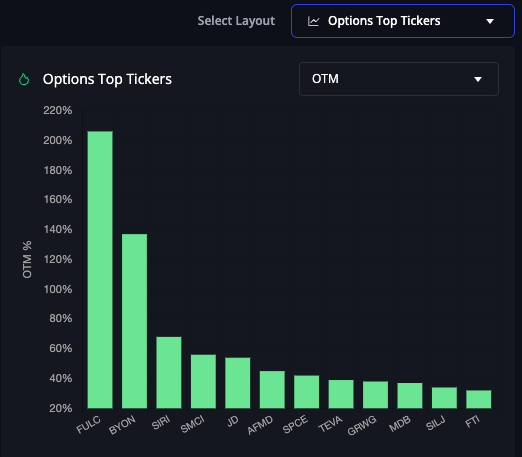
InsiderFinance has multiple Options Flow Top Tickers categories on both the Flow Dashboard and the dedicated Top Tickers Page.
Flow Dashboard:
- Out of the Money (OTM)
- Unusual Out of the Money (OTM)
- Momentum
- Unusual Volume
- Unusual Premium
- Call Volume
- Call Premium
- Put Volume
- Put Premium
- Sweep Volume
- Sweep Premium
Top Tickers Page:
- Unusual Out of the Money (OTM)
- Momentum
- Sweeps
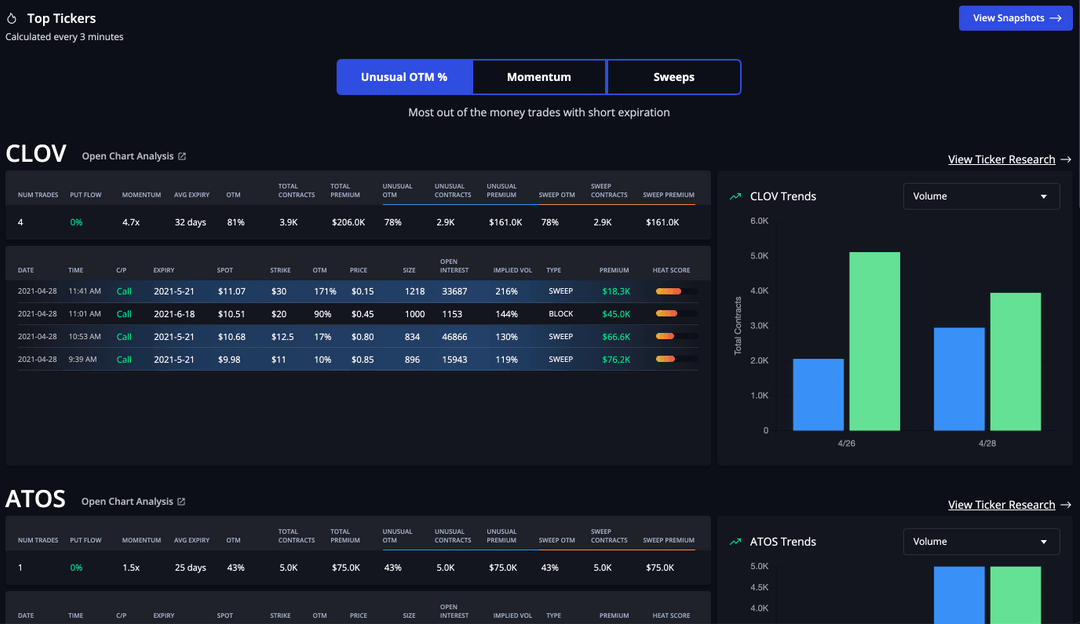
The Top Tickers page features tickers that are different from those on the Flow Dashboard.
The main difference is that any ticker on the Top Tickers page has a strong “agreement” on the trade direction.
These signal categories fit different trading styles and different trade performances.
In our experience, Unusual trades tend to move the “slowest” (1-3 days to play out), and Momentum trades tend to move the “fastest” (often on the same day).
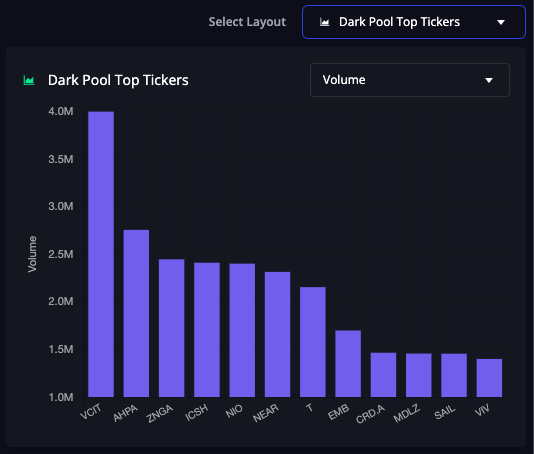
Dark Pool Top Tickers
InsiderFinance has multiple categories of Dark Pool Top Tickers on the Flow Dashboard:
- Premium
- Volume
- Late Buys (Bullish Sentiment)
- Late Sells (Bearish Sentiment)
- Golden Trades (Large Relative Volume)
- Sector Sentiment
Many members have had success adding their favorite top tickers to the watchlist and waiting to enter the trade when they show strong technical indicators.
We recommend using the technical analysis tools included with your subscription.
You can even set custom alerts for any ticker on any time frame to ensure optimal entry and exit.
You can filter the dashboard with our Actionable Presets or Command Center to tailor the top tickers to your trade style.
Any filters applied will be reflected in the Top Tickers on the Flow Dashboard.
HIGH POTENTIAL TRADES SENT DIRECTLY TO YOUR INBOX
Add your email to receive our free daily newsletter. No spam, unsubscribe anytime.
How to Trade Top Tickers
When picking a high-potential top ticker to trade, we like bullish trades on individual tickers with the most support behind them:
Repeated calls and close to 0% put flow
- Close to 0% put flow means that Wall Street is in agreement that the price will rise
Recent dark pool activity
- Green highlights or gold boxes are ideal
Strong technicals
- 4-point confirmation on the 1-hour chart and ideally also the 4-hour chart
Positive news sentiment
- Mostly positive sentiment and no major red flags in recent headlines
Bullish sector activity
- Bullish sector sentiment helps you avoid trading “against the current”
High Heat Scores
- Trades were made with high conviction
Finding a Trade Idea using Top Tickers
One of our favorite strategies for trading Top Tickers is picking an algorithmically curated trade idea straight from the Top Tickers page. It’s that easy!
That doesn’t mean you can trade blindly, though.
Many members have had success adding their favorite top tickers to the watchlist and waiting to enter the trade when they show strong technical indicators.
We recommend using the technical analysis tools included with your subscription.
You can even set custom alerts for any ticker on any time frame.
We recommend the 1-hour and 4-hour charts for Unusual Options Activity, as in the following example.
Here’s an example of the process we use.
First, we find PROG on the Top Tickers page.
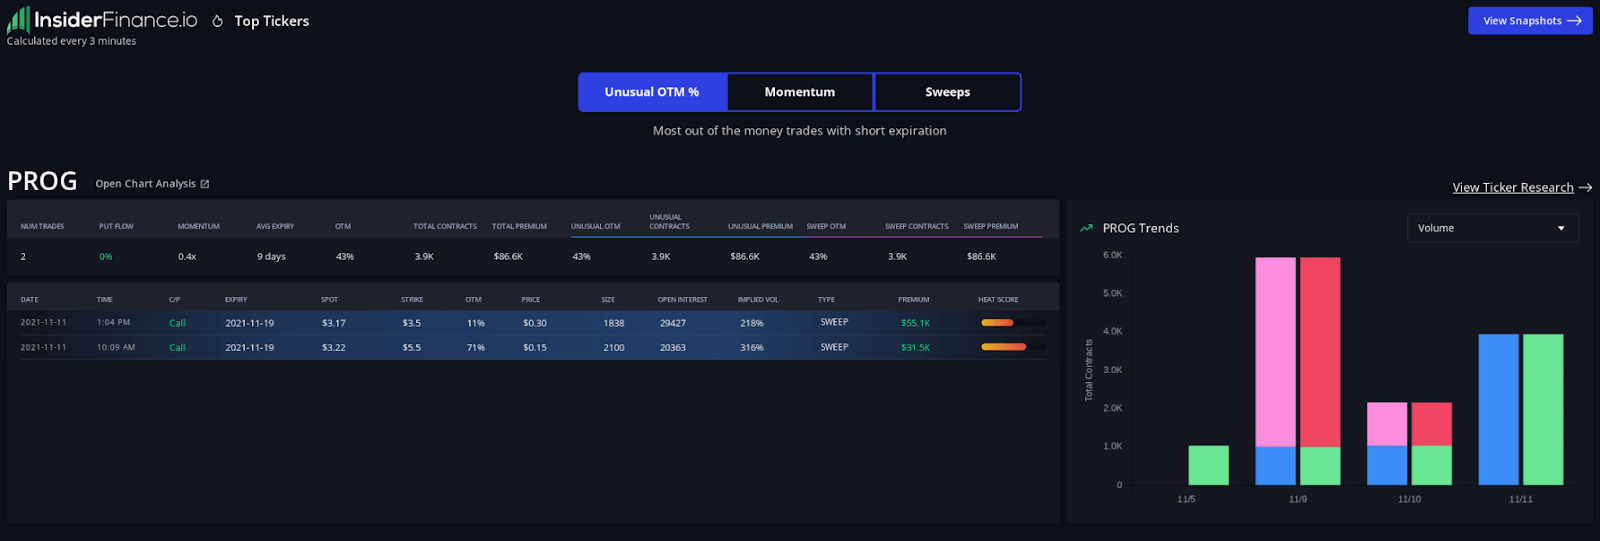
Why do we like it? We see repeated call activity and a trade with a high heat score.
We can’t trade blindly on that, though. The next step is validating the trade idea with technical analysis.
Validating the Trade Idea
Next, let’s check the technicals using the InsiderFinance automated technical analysis tools and set an alert if we don’t like them quite yet.
1-Hour Chart
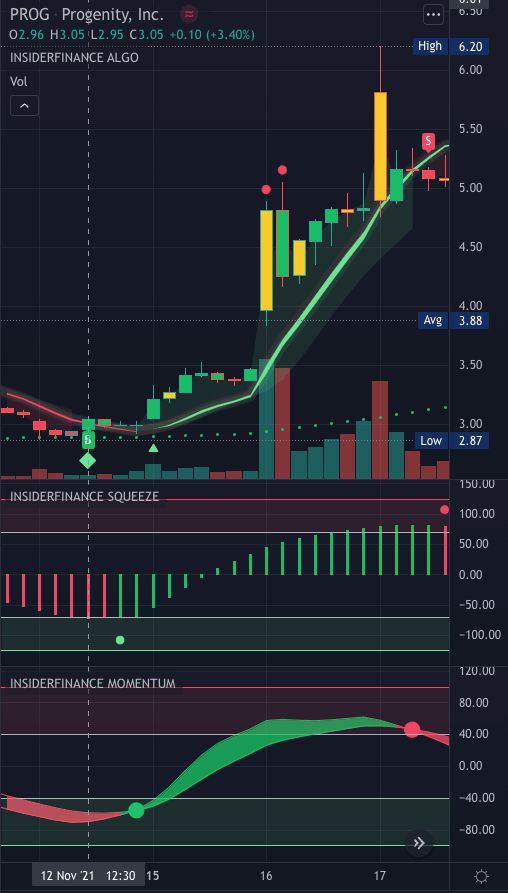
Notice that the initial bullish flow with a high heat score came in on 11/11 around 10 am, but we didn’t receive a Long Signal alert on the 1-hour chart until 11/12 at 12:30 pm.
This is what we mean when we say that Unusual Options Activity can take 1-3 days to play out.
You can see the Trend Reversal Diamond and Trend Confirmation Diamond very close to the Buy Signal.
A few bars later, we see a buy signal on the InsiderFinance Squeeze Indicator and InsiderFinance Momentum Indicator.
Assuming we don’t see any huge red flags on the Ticker Research page, we can consider trading, but you should always set a stop-loss.
Let’s check the 4-hour chart for the “long-term” trend.
4-Hour Chart
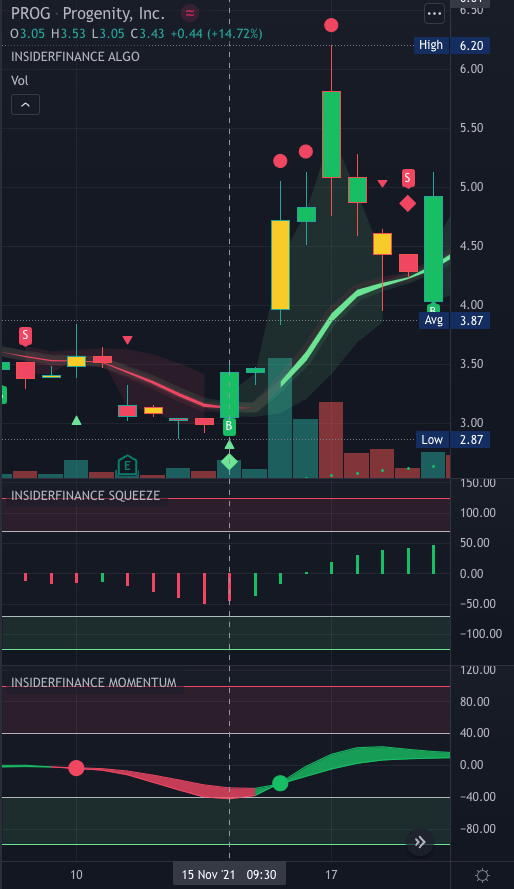
We don’t see a buy signal on the 4-hour chart until 11/15 at 9:30 am, but we see a very strong buy signal reinforced by a Trend Reversal Diamond and Trend Confirmation Triangle.
If we hadn’t entered the position before now, the long-term and short-term technicals would have been pretty compelling.
So what happened? To recap, we spotted PROG as a Top Ticker on 11/11 and received our first alert for a buy signal on the 1-hour chart on 11/12 at 12:30 pm when PROG was trading below $3.
At the peak around 3 trading days later, PROG was trading over $6 for a 100% increase on the underlying ticker!
Since we traded the same options contract as smart money, we had a 400%+ profit in just 3 trading days from the Unusual OTM % Top Ticker PROG!
Signs to Take Profits
Now that you have seen what to look for when entering a position, let’s discuss when you might want to consider taking profits.
We typically look for two main signs to exit a long position: very bearish order flow or a change in technicals, whichever comes first.
To spot the change in order flow, make sure to add the ticker to your watchlist.
If you start to see repeated bear activity, especially with large volumes or premiums, it may be a sign that the uptrend is over.
Our technical analysis system comes with everything you need to identify a change in technicals and time the perfect exit:
Take Profit & Stop Loss Levels
- Three take profit levels and a stop loss level are automatically generated for each buy/sell signal.
- If your trade goes below the stop loss level or above any of the take profit levels, that’s typically a good time to consider taking profits or cutting your losses.
Caution Candles and Dots
- Yellow candles and caution dots can indicate the current trend is slowing down or changing.
- If you start to see multiple yellow candles or caution dots, that’s typically a good time to consider taking profits or cutting your losses.
Trend Changes
- Signs of an opposite trend or a change in trend are worth evaluating.
- For example, if you’re in a long position, consider taking profits or exiting a position when you see sell signals, bear caution dots, or bear trend reversal diamonds.
- If you’re in a short position, consider taking profits or exiting a position when you see buy signals, bull caution dots, or bull trend reversal diamonds.
Look for the above signals to determine the best time to take profits or exit a position. Remember to stick to your trade plan and keep emotion out of the process.
More Resources to Increase Your Returns Using InsiderFinance
Your success is our mission, and we're committed to helping you master the service. We’re actively adding more resources but wanted to share a few we have available:
Our How To Trade Unusual Options Activity guide walks you through how we identify and trade unusual options activity using our platform and includes an in-depth analysis of researching a trade.
Our Guide to Order Flow Tools walks you through our powerful trading tools and how to use them.
Our Explaining the Flow article walks you through how to interpret the options flow and dark pool prints you’re seeing on the dashboard.
Our Guide to Technical Analysis Tools walks you through our powerful charting tools and how to use them.
Our 3 Steps to Trade article captures the typical routine we follow to identify trade opportunities. In general, the more data points you have supporting a trade idea, the higher the probability of success.
Our Videos and Walkthroughs from Real Traders Using InsiderFinance article contains high-quality resources from our content partners that can help you master our service.
We wrote our Advice for New Members article after one of our members reached out about having trouble using the information.
We gave him some suggestions on educational content, and he upgraded to an annual subscription.
We asked specifically what made the difference for him and if we could share his experience with other members, which he was happy to let us.
Of course, our team is always available to help, so reach out if you need us!
HIGH POTENTIAL TRADES SENT DIRECTLY TO YOUR INBOX
Add your email to receive our free daily newsletter. No spam, unsubscribe anytime.


