HTA 1-Hour Chart Analysis
When trading options, we tend to look at the 1-hour and 4-hour charts to gain the "short-term" and "long-term" perspectives.
We find that many unusual options trades also have strong technicals on the 1-hour chart, which seems to be the time frame many institutions use to trade.
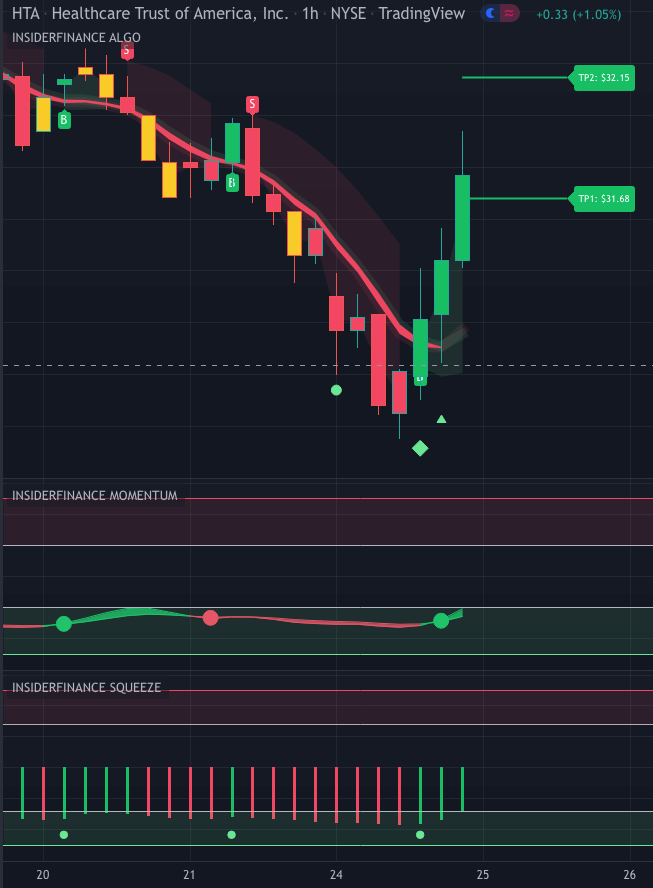
1-Hour Chart

The 1-hour chart above seems to have pretty strong technicals.
The Algorithm is in a buy trend. The swing diamond and trend triangle confirm the trend, and both the Momentum and Squeeze indicators also show buy signals.
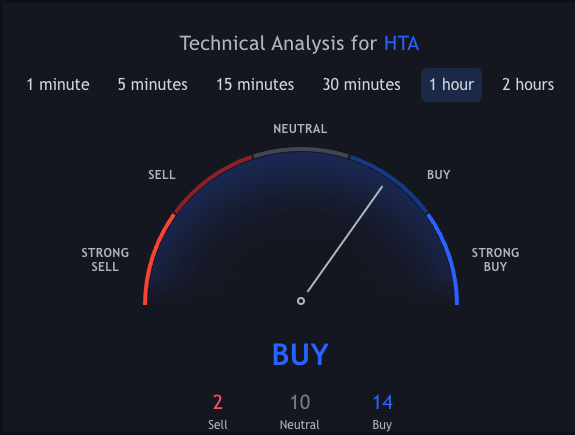
Technical Analysis Widget

The Technical Analysis widget seems to agree with our charting tools, so we can conclude that HTA has a pretty solid technical setup for the “short-term” outlook.
Let's see if we see the same on the 4-hour chart.


