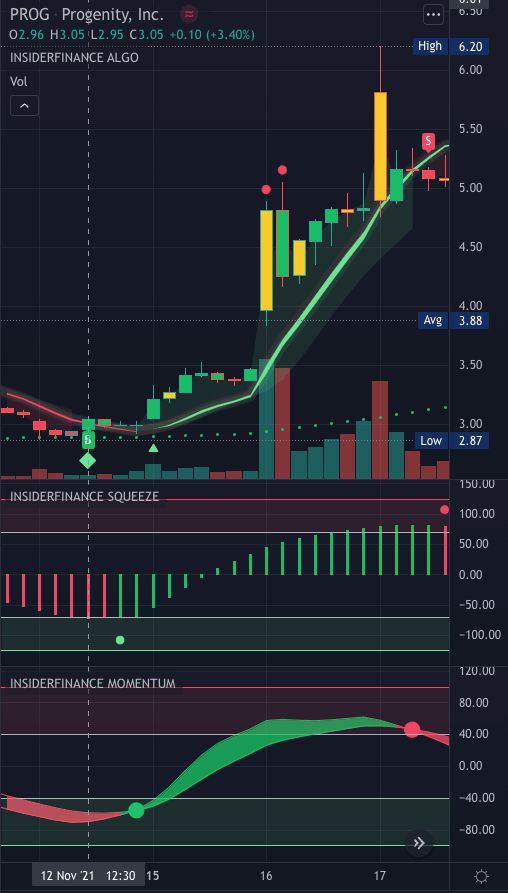
PROG 1-Hour Chart Analysis

Next, let’s check the technicals using the InsiderFinance automated technical analysis tools and set an alert if we don’t like them yet.
On the Top Tickers flow for PROG, we saw that the initial bullish flow with a high heat score came in on 11/11 around 10 am.
However, we didn’t receive a Long Signal alert (shown as a green diamond) on the 1-hour chart until 11/12 at 12:30 pm.
This is what we mean when we say that Unusual Options Activity can take 1-3 days to play out.
You can see the Swing Diamond and Triangle very close to the Buy Signal, strongly confirming the Algo buy signal.
A few bars later, we see a buy signal on the InsiderFinance Squeeze Indicator and InsiderFinance Momentum Indicator, the other confirmations we look for before entering a position.
Assuming we don’t see any huge red flags on the Ticker Research page, we can consider trading.
You should always set a stop-loss as market conditions are unpredictable.
Let’s check the 4-hour chart for the “long-term” trend.


